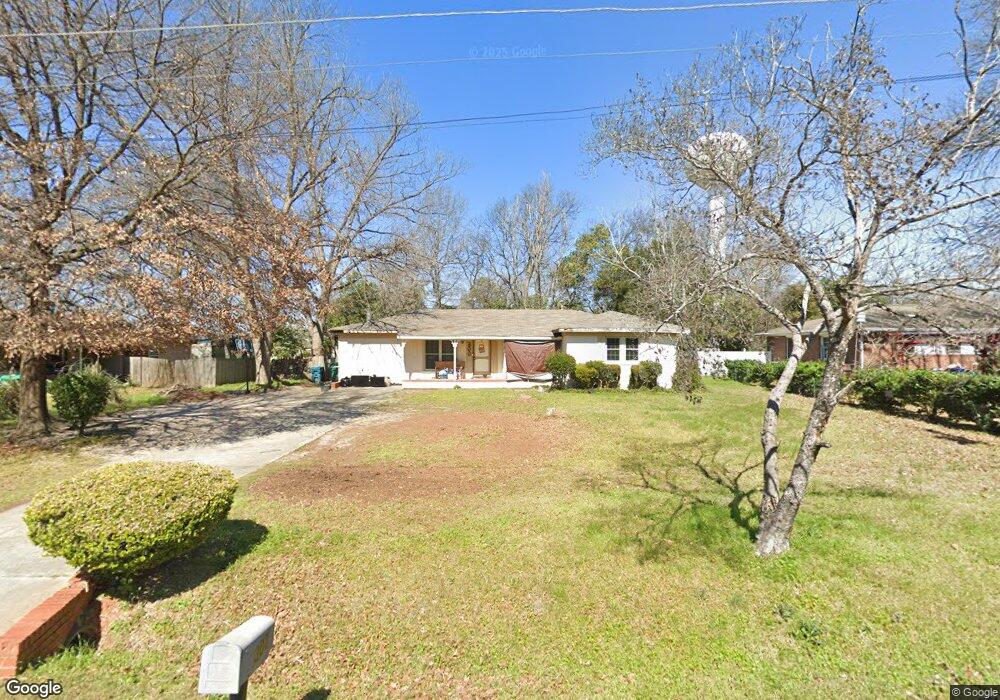
300 Heather St Warner Robins, GA 31093
Estimated Value: $163,000 - $178,000
3
Beds
2
Baths
1,626
Sq Ft
$106/Sq Ft
Est. Value
About This Home
This home is located at 300 Heather St, Warner Robins, GA 31093 and is currently estimated at $172,115, approximately $105 per square foot. 300 Heather St is a home located in Houston County with nearby schools including Westside Elementary School, Northside Middle School, and Northside High School.
Ownership History
Date
Name
Owned For
Owner Type
Purchase Details
Closed on
Jan 31, 1997
Sold by
Secretary Of Veterans Affairs
Bought by
Johnson Lisa M
Current Estimated Value
Purchase Details
Closed on
Nov 5, 1996
Sold by
Suntrust Mortgage Inc
Bought by
Secretary Of Veterans Affairs
Purchase Details
Closed on
Dec 28, 1992
Sold by
Lewis Julian L and Lewis Joanna C
Bought by
Johnson Willie B and Lisa M*
Purchase Details
Closed on
Oct 20, 1986
Sold by
Reagan Ralph R
Bought by
Lewis Julian L and Lewis Joanna C
Purchase Details
Closed on
Jul 17, 1978
Sold by
Cranford Larry O and Cranford Olivia S
Bought by
Reagan Ralph R
Purchase Details
Closed on
Jul 5, 1968
Sold by
Mitchell Cleo B and Mitchell Juanita M
Bought by
Cranford Larry O and Cranford Olivia S
Purchase Details
Closed on
Dec 9, 1966
Sold by
Tower Inc
Bought by
Mitchell Cleo B and Mitchell Juanita M
Purchase Details
Closed on
Sep 9, 1964
Bought by
Tower Inc
Create a Home Valuation Report for This Property
The Home Valuation Report is an in-depth analysis detailing your home's value as well as a comparison with similar homes in the area
Home Values in the Area
Average Home Value in this Area
Purchase History
| Date | Buyer | Sale Price | Title Company |
|---|---|---|---|
| Johnson Lisa M | -- | -- | |
| Secretary Of Veterans Affairs | -- | -- | |
| Suntrust Mortgage Inc | $45,000 | -- | |
| Johnson Willie B | $64,200 | -- | |
| Lewis Julian L | -- | -- | |
| Reagan Ralph R | -- | -- | |
| Cranford Larry O | -- | -- | |
| Mitchell Cleo B | -- | -- | |
| Tower Inc | -- | -- |
Source: Public Records
Tax History Compared to Growth
Tax History
| Year | Tax Paid | Tax Assessment Tax Assessment Total Assessment is a certain percentage of the fair market value that is determined by local assessors to be the total taxable value of land and additions on the property. | Land | Improvement |
|---|---|---|---|---|
| 2024 | $605 | $27,288 | $6,200 | $21,088 |
| 2023 | $531 | $23,968 | $6,200 | $17,768 |
| 2022 | $484 | $22,008 | $5,000 | $17,008 |
| 2021 | $562 | $25,120 | $5,000 | $20,120 |
| 2020 | $565 | $25,160 | $5,000 | $20,160 |
| 2019 | $565 | $25,160 | $5,000 | $20,160 |
| 2018 | $723 | $31,600 | $5,000 | $26,600 |
| 2017 | $723 | $31,600 | $5,000 | $26,600 |
| 2016 | $724 | $31,600 | $5,000 | $26,600 |
| 2015 | $726 | $31,600 | $5,000 | $26,600 |
| 2014 | -- | $31,600 | $5,000 | $26,600 |
| 2013 | -- | $31,600 | $5,000 | $26,600 |
Source: Public Records
Map
Nearby Homes