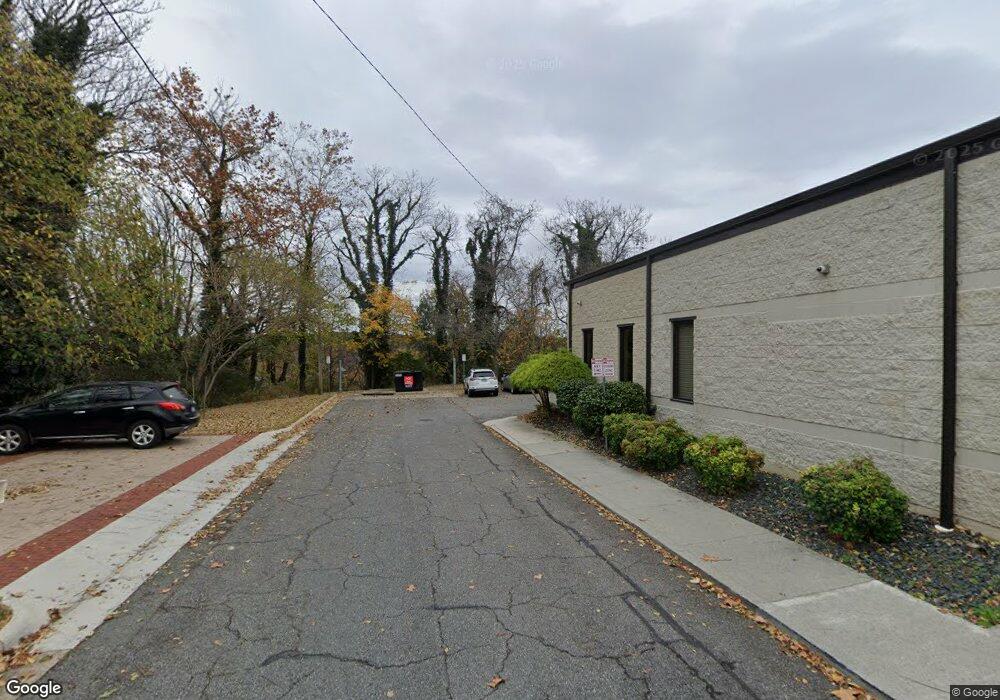
300 Lucado Place Lynchburg, VA 24504
Garland Hill NeighborhoodEstimated Value: $2,147,862
--
Bed
--
Bath
24,257
Sq Ft
$89/Sq Ft
Est. Value
About This Home
This home is located at 300 Lucado Place, Lynchburg, VA 24504 and is currently estimated at $2,147,862, approximately $88 per square foot. 300 Lucado Place is a home located in Lynchburg City with nearby schools including Paul Munro Elementary School, Linkhorne Middle School, and E.C. Glass High School.
Ownership History
Date
Name
Owned For
Owner Type
Purchase Details
Closed on
Jun 30, 2016
Sold by
First Properties Inc
Bought by
Central Virginia Foundation For Economic
Current Estimated Value
Purchase Details
Closed on
Oct 7, 2015
Sold by
River James Properties Llc
Bought by
First Properties Inc
Purchase Details
Closed on
May 2, 2007
Sold by
Industrial Development Authority Of City
Bought by
River James Properties Llc
Create a Home Valuation Report for This Property
The Home Valuation Report is an in-depth analysis detailing your home's value as well as a comparison with similar homes in the area
Home Values in the Area
Average Home Value in this Area
Purchase History
| Date | Buyer | Sale Price | Title Company |
|---|---|---|---|
| Central Virginia Foundation For Economic | $1,075,000 | None Available | |
| First Properties Inc | $1,075,000 | None Available | |
| River James Properties Llc | -- | None Available |
Source: Public Records
Tax History Compared to Growth
Tax History
| Year | Tax Paid | Tax Assessment Tax Assessment Total Assessment is a certain percentage of the fair market value that is determined by local assessors to be the total taxable value of land and additions on the property. | Land | Improvement |
|---|---|---|---|---|
| 2025 | $15,456 | $1,840,000 | $334,300 | $1,505,700 |
| 2024 | $14,676 | $1,649,000 | $334,300 | $1,314,700 |
| 2023 | $14,676 | $1,649,000 | $334,300 | $1,314,700 |
| 2022 | $15,450 | $1,500,000 | $334,300 | $1,165,700 |
| 2021 | $16,650 | $1,500,000 | $334,300 | $1,165,700 |
| 2020 | $15,984 | $1,440,000 | $334,300 | $1,105,700 |
| 2019 | $15,984 | $1,440,000 | $334,300 | $1,105,700 |
| 2018 | $14,642 | $1,319,100 | $133,500 | $1,185,600 |
| 2017 | $14,642 | $1,319,100 | $133,500 | $1,185,600 |
| 2016 | $14,642 | $1,319,100 | $133,500 | $1,185,600 |
| 2015 | $10,982 | $1,302,100 | $126,100 | $1,176,000 |
| 2014 | $14,453 | $1,302,100 | $126,100 | $1,176,000 |
Source: Public Records
Map
Nearby Homes