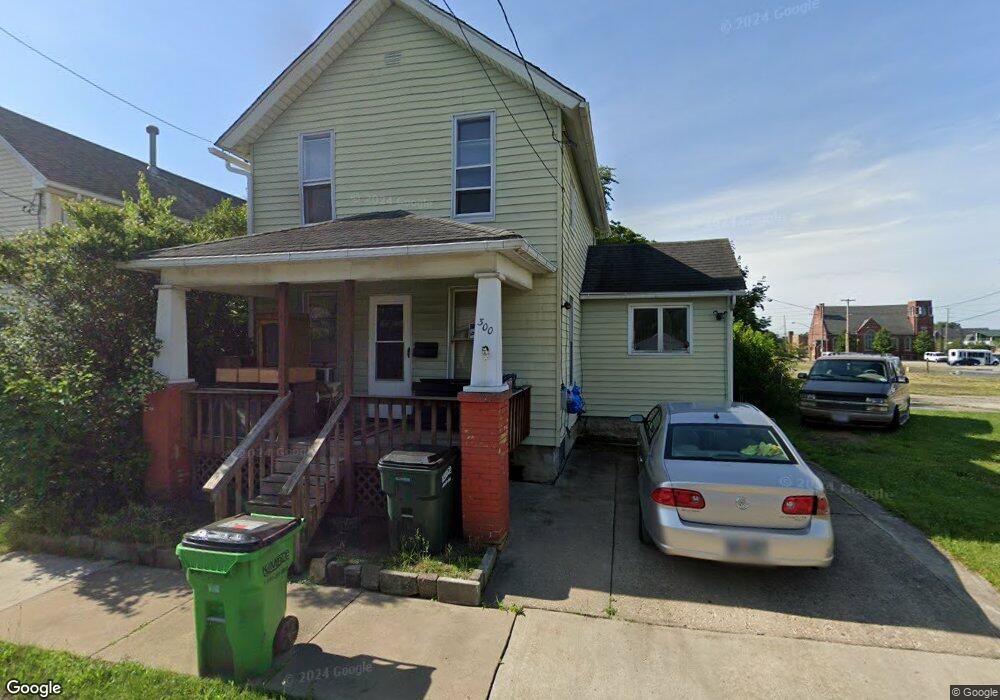
300 Lucas St Barberton, OH 44203
Estimated Value: $79,000 - $100,000
2
Beds
1
Bath
1,074
Sq Ft
$83/Sq Ft
Est. Value
About This Home
This home is located at 300 Lucas St, Barberton, OH 44203 and is currently estimated at $89,333, approximately $83 per square foot. 300 Lucas St is a home located in Summit County with nearby schools including Barberton Middle School, Barberton High School, and St Augustine Elementary School.
Ownership History
Date
Name
Owned For
Owner Type
Purchase Details
Closed on
Jan 2, 2023
Sold by
Laury Frank P and Laury Julie M
Bought by
Laury Frank P
Current Estimated Value
Purchase Details
Closed on
Nov 27, 2007
Sold by
Us Bank Na
Bought by
Laury Frank P and Laury Julie M
Purchase Details
Closed on
May 31, 2007
Sold by
Yarnell Wendy L
Bought by
Us Bank Na and Asset Backed Securities Corp Home Equity
Purchase Details
Closed on
Feb 13, 2004
Sold by
Varga John A and Varga Steve J
Bought by
Yarnell Wendy L
Home Financials for this Owner
Home Financials are based on the most recent Mortgage that was taken out on this home.
Original Mortgage
$51,775
Interest Rate
7.7%
Mortgage Type
Purchase Money Mortgage
Purchase Details
Closed on
Jan 16, 1996
Sold by
Varga Elizabeth
Bought by
Varga John A and Varga Steve J
Create a Home Valuation Report for This Property
The Home Valuation Report is an in-depth analysis detailing your home's value as well as a comparison with similar homes in the area
Home Values in the Area
Average Home Value in this Area
Purchase History
| Date | Buyer | Sale Price | Title Company |
|---|---|---|---|
| Laury Frank P | -- | -- | |
| Laury Frank P | $10,000 | Landcastle Title | |
| Us Bank Na | $46,000 | None Available | |
| Yarnell Wendy L | $54,500 | Village Title Agency | |
| Varga John A | $1,000 | -- |
Source: Public Records
Mortgage History
| Date | Status | Borrower | Loan Amount |
|---|---|---|---|
| Previous Owner | Yarnell Wendy L | $51,775 |
Source: Public Records
Tax History Compared to Growth
Tax History
| Year | Tax Paid | Tax Assessment Tax Assessment Total Assessment is a certain percentage of the fair market value that is determined by local assessors to be the total taxable value of land and additions on the property. | Land | Improvement |
|---|---|---|---|---|
| 2025 | $1,093 | $19,338 | $3,941 | $15,397 |
| 2024 | $1,093 | $19,338 | $3,941 | $15,397 |
| 2023 | $1,093 | $19,338 | $3,941 | $15,397 |
| 2022 | $880 | $14,875 | $3,031 | $11,844 |
| 2021 | $879 | $14,875 | $3,031 | $11,844 |
| 2020 | $861 | $14,870 | $3,030 | $11,840 |
| 2019 | $833 | $13,030 | $3,490 | $9,540 |
| 2018 | $820 | $13,030 | $3,490 | $9,540 |
| 2017 | $954 | $13,030 | $3,490 | $9,540 |
| 2016 | $956 | $14,960 | $3,490 | $11,470 |
| 2015 | $954 | $14,960 | $3,490 | $11,470 |
| 2014 | $949 | $14,960 | $3,490 | $11,470 |
| 2013 | $916 | $14,960 | $3,490 | $11,470 |
Source: Public Records
Map
Nearby Homes
- 564 W Hopocan Ave
- 387 4th St NW
- 583 Creedmore Ave
- 46 Brown St
- 610 Creedmore Ave
- 39 Brown St
- 442 Wooster Rd N
- 553 Princeton Ave
- 673 Wooster Rd W
- 679 Wooster Rd W
- 636 Wesleyan Ave
- 613 Wooster Rd N
- 344 E Huston St
- 349 E Hopocan Ave
- 217 W Summit St
- 25 S Van Buren Ave
- 357 E Paige Ave
- 43 S Van Buren Ave
- 645 Madison Ave
- 0 Wooster Rd N