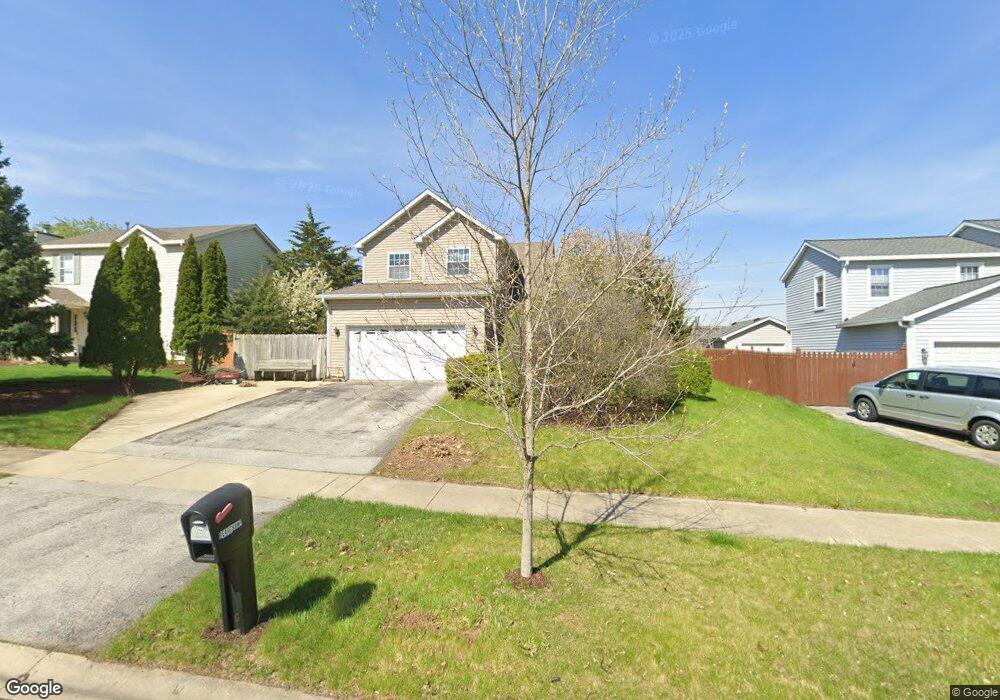
300 Magnolia Dr North Aurora, IL 60542
Estimated Value: $363,245 - $388,000
3
Beds
3
Baths
1,696
Sq Ft
$219/Sq Ft
Est. Value
About This Home
This home is located at 300 Magnolia Dr, North Aurora, IL 60542 and is currently estimated at $371,061, approximately $218 per square foot. 300 Magnolia Dr is a home located in Kane County with nearby schools including Goodwin Elementary School, Jewel Middle School, and West Aurora High School.
Ownership History
Date
Name
Owned For
Owner Type
Purchase Details
Closed on
Oct 1, 2018
Sold by
Pennington James D and Pennington Caryn M
Bought by
Beauchamp Nicole M
Current Estimated Value
Home Financials for this Owner
Home Financials are based on the most recent Mortgage that was taken out on this home.
Original Mortgage
$137,400
Outstanding Balance
$119,821
Interest Rate
4.5%
Mortgage Type
New Conventional
Estimated Equity
$251,240
Purchase Details
Closed on
Aug 22, 2018
Sold by
Pennington James D and Pennington Caryn M
Bought by
Pennington James D and Pennington Caryn M
Home Financials for this Owner
Home Financials are based on the most recent Mortgage that was taken out on this home.
Original Mortgage
$137,400
Outstanding Balance
$119,821
Interest Rate
4.5%
Mortgage Type
New Conventional
Estimated Equity
$251,240
Purchase Details
Closed on
May 18, 2007
Sold by
Polerecky Michael A and Pennington Caryn M
Bought by
Pennington James D and Pennington Caryn M
Home Financials for this Owner
Home Financials are based on the most recent Mortgage that was taken out on this home.
Original Mortgage
$160,000
Interest Rate
6.54%
Mortgage Type
New Conventional
Create a Home Valuation Report for This Property
The Home Valuation Report is an in-depth analysis detailing your home's value as well as a comparison with similar homes in the area
Home Values in the Area
Average Home Value in this Area
Purchase History
| Date | Buyer | Sale Price | Title Company |
|---|---|---|---|
| Beauchamp Nicole M | -- | Chicago Title | |
| Pennington James D | -- | None Available | |
| Pennington James D | -- | Law Title Insurance Oswego |
Source: Public Records
Mortgage History
| Date | Status | Borrower | Loan Amount |
|---|---|---|---|
| Open | Beauchamp Nicole M | $137,400 | |
| Previous Owner | Pennington James D | $160,000 |
Source: Public Records
Tax History Compared to Growth
Tax History
| Year | Tax Paid | Tax Assessment Tax Assessment Total Assessment is a certain percentage of the fair market value that is determined by local assessors to be the total taxable value of land and additions on the property. | Land | Improvement |
|---|---|---|---|---|
| 2024 | $6,580 | $94,721 | $14,036 | $80,685 |
| 2023 | $6,404 | $85,969 | $12,739 | $73,230 |
| 2022 | $6,205 | $80,345 | $11,906 | $68,439 |
| 2021 | $5,969 | $76,200 | $11,292 | $64,908 |
| 2020 | $5,947 | $74,735 | $11,075 | $63,660 |
| 2019 | $6,009 | $72,089 | $10,683 | $61,406 |
| 2018 | $5,959 | $69,343 | $10,276 | $59,067 |
| 2017 | $5,911 | $67,056 | $9,937 | $57,119 |
| 2016 | $5,895 | $65,103 | $9,648 | $55,455 |
| 2015 | -- | $63,620 | $9,428 | $54,192 |
| 2014 | -- | $61,617 | $9,131 | $52,486 |
| 2013 | -- | $62,653 | $11,191 | $51,462 |
Source: Public Records
Map
Nearby Homes
- 791 Cottonwood Dr
- 438 Mallard Point Dr
- 442 Mallard Point Dr
- 727 Harmony Ct
- 504 Dogwood Ct
- 109 E Victoria Cir Unit 7/5
- 22 Silver Trail Unit 2
- 203 E Victoria Cir Unit 9/2
- 201 Hidden Creek Ln Unit 301
- 523 Mallard Point Dr Unit 1
- 311 Hidden Creek Ln Unit 311
- 302 Pin Oak Dr
- 413 N Sycamore Ln
- 1202 Fox Hill Ln Unit 362
- 316 E Victoria Cir Unit 125
- 508 Pinewood Dr
- 413 Messenger Cir
- 341 Pheasant Hill Dr
- 1432 Hartsburg Ln Unit 1
- 43 S Juniper Dr Unit 3
- 302 Magnolia Dr
- 226 Magnolia Dr
- 224 Magnolia Dr
- 304 Magnolia Dr
- 301 Magnolia Dr
- 225 Magnolia Dr
- 306 Magnolia Dr
- 303 Magnolia Dr
- 222 Magnolia Dr
- 223 Magnolia Dr
- 305 Magnolia Dr
- 220 Magnolia Dr
- 308 Magnolia Dr
- 221 Magnolia Dr
- 307 Magnolia Dr
- 219 Magnolia Dr
- 310 Magnolia Dr
- 309 Magnolia Dr
- 218 Magnolia Dr
- 300 Acorn Dr