
Seller's Agent in 2025
Ann Olivo
J. Barrett & Company
(508) 942-4323
15 in this area
80 Total Sales
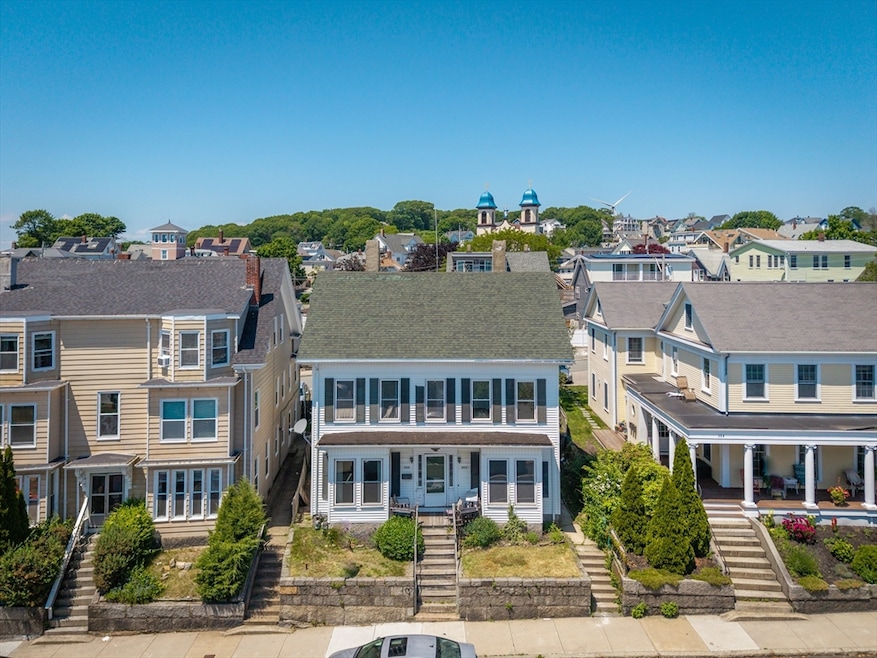

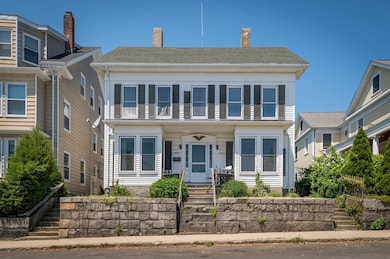


EXCELLENT PRICE FOR THIS DOWNTOWN SIDE BY SIDE TWO-FAMILY. THIS PROPERTY HAS MANY POSSIBILITIES AS WHAT TO DO WITH THE TWO UNITS. FROM MULTI-GENERATIONAL LIVING, INVESTORS OR RENTAL INCOME POTENTIAL. THE CENTRAL LOCATION MAKES IT EASY TO ACCESS THE HEART OF DOWNTOWN GLOUCESTER FOR RESTAURANTS, ,MUSEUMS AND THE HISTORICAL GLOUCESTER HARBOR.
| Date | Type | Sale Price | Title Company |
|---|---|---|---|
| Quit Claim Deed | $580,000 | -- | |
| Deed | $280,000 | -- |
| Date | Status | Loan Amount | Loan Type |
|---|---|---|---|
| Open | $650,000 | Commercial | |
| Previous Owner | $130,000 | Purchase Money Mortgage |
| Date | Event | Price | List to Sale | Price per Sq Ft |
|---|---|---|---|---|
| 11/07/2025 11/07/25 | Sold | $580,000 | -6.3% | $220 / Sq Ft |
| 09/24/2025 09/24/25 | Pending | -- | -- | -- |
| 09/16/2025 09/16/25 | Price Changed | $619,000 | -10.9% | $235 / Sq Ft |
| 08/20/2025 08/20/25 | Price Changed | $695,000 | -7.2% | $264 / Sq Ft |
| 07/29/2025 07/29/25 | Price Changed | $749,000 | -6.4% | $284 / Sq Ft |
| 06/24/2025 06/24/25 | For Sale | $800,000 | -- | $303 / Sq Ft |
| Year | Tax Paid | Tax Assessment Tax Assessment Total Assessment is a certain percentage of the fair market value that is determined by local assessors to be the total taxable value of land and additions on the property. | Land | Improvement |
|---|---|---|---|---|
| 2025 | $5,414 | $557,000 | $129,200 | $427,800 |
| 2024 | $5,321 | $546,900 | $123,100 | $423,800 |
| 2023 | $5,504 | $519,700 | $109,900 | $409,800 |
| 2022 | $5,151 | $439,100 | $95,600 | $343,500 |
| 2021 | $4,980 | $400,300 | $86,900 | $313,400 |
| 2020 | $4,714 | $382,300 | $86,900 | $295,400 |
| 2019 | $4,368 | $344,200 | $86,900 | $257,300 |
| 2018 | $4,060 | $314,000 | $86,900 | $227,100 |
| 2017 | $3,816 | $289,300 | $78,200 | $211,100 |
| 2016 | $3,641 | $267,500 | $78,200 | $189,300 |
| 2015 | $3,571 | $261,600 | $78,200 | $183,400 |
Seller's Agent in 2025
Ann Olivo
J. Barrett & Company
(508) 942-4323
15 in this area
80 Total Sales
R
Seller Co-Listing Agent in 2025
Rick Marshall
J. Barrett & Company
(978) 314-2015
3 in this area
6 Total Sales
Source: MLS Property Information Network (MLS PIN)
MLS Number: 73395724
APN: GLOU-000012-000090
Disclaimer: Certain information contained herein is derived from information provided by parties other than Homes.com. All information provided is deemed reliable, but is not guaranteed to be accurate and should be independently verified.
![]() The property listing data and information, or the Images, set forth herein were provided to MLS Property Information Network, Inc. from third party sources, including sellers, lessors and public records, and were compiled by MLS Property Information Network, Inc. The property listing data and information, and the Images, are for the personal, non-commercial use of consumers having a good faith interest in purchasing or leasing listed properties of the type displayed to them and may not be used for any purpose other than to identify prospective properties which such consumers may have a good faith interest in purchasing or leasing. MLS Property Information Network, Inc. and its subscribers disclaim any and all representations and warranties as to the accuracy of the property listing data and information, or as to the accuracy of any of the Images, set forth herein.
The property listing data and information, or the Images, set forth herein were provided to MLS Property Information Network, Inc. from third party sources, including sellers, lessors and public records, and were compiled by MLS Property Information Network, Inc. The property listing data and information, and the Images, are for the personal, non-commercial use of consumers having a good faith interest in purchasing or leasing listed properties of the type displayed to them and may not be used for any purpose other than to identify prospective properties which such consumers may have a good faith interest in purchasing or leasing. MLS Property Information Network, Inc. and its subscribers disclaim any and all representations and warranties as to the accuracy of the property listing data and information, or as to the accuracy of any of the Images, set forth herein.
Ask me questions while you tour the home.