


300 Manning St Carroll, NE 68723
Estimated payment $451/month
Highlights
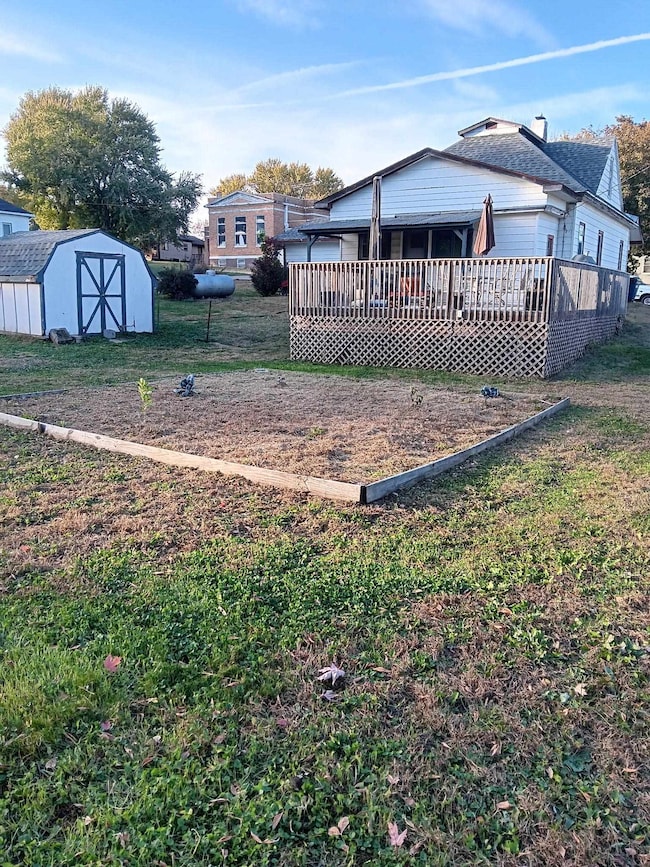
- Deck
- Wood Flooring
- Mud Room
- Wayne High School Rated A-
- Main Floor Primary Bedroom
- Enclosed Patio or Porch
About This Home
Looking for Affordable small-town living? Step inside the enclosed front porch to have your morning coffee. Next the large living room with original wood floors. There's a Cozy kitchen with a breakfast nook, 2 bedrooms on the main floor (currently one bedroom being used as a formal dining area) with original wood floors. Large 3rd bedroom upstairs with attic storage. Convenient main floor laundry and pantry. All appliances stay including washer and dryer. Attached oversize 2 car garage. Newer Features include Roof new '21, new HVAC and duct work in '23, new garage doors/remote '24, and newer 20x26 deck in '20 plus additional 13x8 porch. Home sits on 3 LOTS in a quiet neighborhood on a corner. There's an oversized lawn shed with wood floor. Just minutes from Wayne, 24 miles from Norfolk, 50 miles from Yankton or Sioux City! Pet friendly town! Call/Text for a private showing!
Home Details
Home Type
- Single Family
Est. Annual Taxes
- $869
Year Built
- Built in 1910
Home Design
- Frame Construction
- Asphalt Roof
- Hardboard
Interior Spaces
- 1,380 Sq Ft Home
- Window Treatments
- Mud Room
- Living Room
- Combination Kitchen and Dining Room
- Partial Basement
Kitchen
- Breakfast Area or Nook
- Eat-In Kitchen
- Electric Range
- Microwave
- Disposal
Flooring
- Wood
- Vinyl
Bedrooms and Bathrooms
- 3 Bedrooms | 2 Main Level Bedrooms
- Primary Bedroom on Main
- 1 Bathroom
Laundry
- Laundry on main level
- Dryer
- Washer
Parking
- 2 Car Attached Garage
- Garage Door Opener
Outdoor Features
- Deck
- Enclosed Patio or Porch
- Storage Shed
Utilities
- Central Air
- Propane Water Heater
Listing and Financial Details
- Assessor Parcel Number 0005208.00
Map
Home Values in the Area
Average Home Value in this Area
Tax History
| Year | Tax Paid | Tax Assessment Tax Assessment Total Assessment is a certain percentage of the fair market value that is determined by local assessors to be the total taxable value of land and additions on the property. | Land | Improvement |
|---|---|---|---|---|
| 2025 | $869 | $65,785 | $4,120 | $61,665 |
| 2024 | $869 | $64,295 | $2,630 | $61,665 |
| 2023 | $964 | $54,985 | $2,630 | $52,355 |
| 2022 | $800 | $46,740 | $2,630 | $44,110 |
| 2021 | $545 | $30,280 | $2,630 | $27,650 |
| 2020 | $505 | $28,335 | $2,630 | $25,705 |
| 2019 | $412 | $23,580 | $2,630 | $20,950 |
| 2018 | $421 | $23,580 | $2,630 | $20,950 |
| 2017 | $419 | $23,580 | $2,630 | $20,950 |
| 2016 | $441 | $0 | $0 | $0 |
| 2015 | $432 | $23,580 | $2,630 | $20,950 |
| 2014 | -- | $23,580 | $2,630 | $20,950 |
| 2013 | -- | $23,580 | $2,630 | $20,950 |
Property History
| Date | Event | Price | List to Sale | Price per Sq Ft |
|---|---|---|---|---|
| 11/26/2025 11/26/25 | Price Changed | $72,000 | -6.5% | $52 / Sq Ft |
| 11/05/2025 11/05/25 | Price Changed | $77,000 | -20.6% | $56 / Sq Ft |
| 10/27/2025 10/27/25 | For Sale | $97,000 | -- | $70 / Sq Ft |
Purchase History
| Date | Type | Sale Price | Title Company |
|---|---|---|---|
| Warranty Deed | $50,000 | None Listed On Document |
Mortgage History
| Date | Status | Loan Amount | Loan Type |
|---|---|---|---|
| Open | $56,000 | Credit Line Revolving |
Source: Norfolk Board of REALTORS®
MLS Number: 250797
APN: 0005208.00
Disclaimer: Certain information contained herein is derived from information provided by parties other than Homes.com. All information provided is deemed reliable, but is not guaranteed to be accurate and should be independently verified.
![]() IDX information is provided exclusively for personal, non-commercial use, and may not be used for any purpose other than to identify prospective properties consumers may be interested in purchasing. Information is deemed reliable but not guaranteed.
IDX information is provided exclusively for personal, non-commercial use, and may not be used for any purpose other than to identify prospective properties consumers may be interested in purchasing. Information is deemed reliable but not guaranteed.
- 318 W 2nd St Unit 5
- 801 E 4th St
- 1015 Sunrise Dr
- 1401 Lakewood Dr
- 901 Syracuse Ave
- 1308 Galeta Ave Unit A
- 815 W Benjamin Ave Unit 3
- 1305 Galeta Ave Unit C
- 1303 Galeta Ave
- 300 Oak St
- 1002 N 10th St
- 701 W Maple Ave
- 1301 E Grove Ave
- 313 N 8th St
- 609 Blaine St Unit 2
- 414 W Phillip Ave
- 724 S 18th St
- 403 S Robinson Ave Unit The Residence
