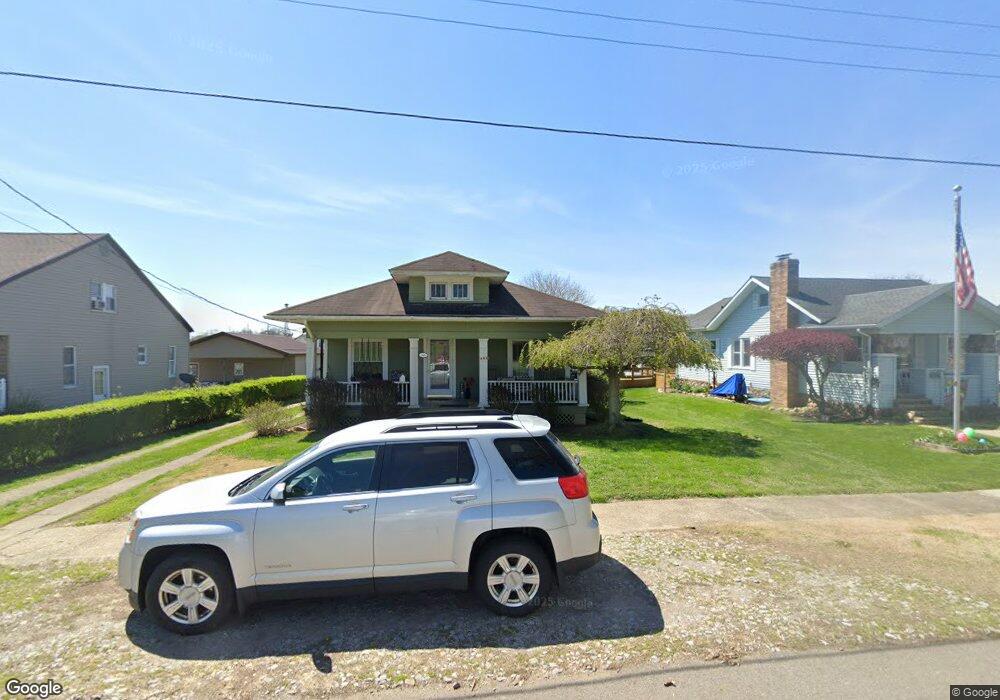
300 Maple St Duncan Falls, OH 43734
Estimated Value: $223,000 - $264,000
2
Beds
1
Bath
1,246
Sq Ft
$193/Sq Ft
Est. Value
About This Home
This home is located at 300 Maple St, Duncan Falls, OH 43734 and is currently estimated at $240,220, approximately $192 per square foot. 300 Maple St is a home located in Muskingum County with nearby schools including Philo High School.
Ownership History
Date
Name
Owned For
Owner Type
Purchase Details
Closed on
Jul 14, 2009
Sold by
Secretary Of Housing & Urban Development
Bought by
Fink Troy
Current Estimated Value
Purchase Details
Closed on
Mar 30, 2009
Sold by
Countrywide Home Loans Inc
Bought by
The Secretary Department Of Housing & Ur
Purchase Details
Closed on
Mar 3, 2009
Sold by
Tucker Shari L
Bought by
Countrywide Home Loans Inc
Purchase Details
Closed on
Jul 1, 2003
Sold by
Tucker Jeffrey R
Bought by
Tucker Shari L
Purchase Details
Closed on
Aug 19, 1998
Sold by
Hull Gregory K
Bought by
Tucker Jeffrey R and Tucker Shari L
Home Financials for this Owner
Home Financials are based on the most recent Mortgage that was taken out on this home.
Original Mortgage
$84,258
Interest Rate
6.99%
Mortgage Type
New Conventional
Create a Home Valuation Report for This Property
The Home Valuation Report is an in-depth analysis detailing your home's value as well as a comparison with similar homes in the area
Purchase History
| Date | Buyer | Sale Price | Title Company |
|---|---|---|---|
| Fink Troy | $63,001 | Lakeside Title & Escrow Agen | |
| The Secretary Department Of Housing & Ur | -- | None Available | |
| Countrywide Home Loans Inc | $52,000 | None Available | |
| Tucker Shari L | -- | -- | |
| Tucker Jeffrey R | $100,000 | -- |
Source: Public Records
Mortgage History
| Date | Status | Borrower | Loan Amount |
|---|---|---|---|
| Previous Owner | Tucker Jeffrey R | $84,258 |
Source: Public Records
Tax History
| Year | Tax Paid | Tax Assessment Tax Assessment Total Assessment is a certain percentage of the fair market value that is determined by local assessors to be the total taxable value of land and additions on the property. | Land | Improvement |
|---|---|---|---|---|
| 2024 | $1,801 | $54,495 | $4,480 | $50,015 |
| 2023 | $1,351 | $38,780 | $3,465 | $35,315 |
| 2022 | $1,297 | $38,780 | $3,465 | $35,315 |
| 2021 | $1,277 | $38,780 | $3,465 | $35,315 |
| 2020 | $1,153 | $35,245 | $3,150 | $32,095 |
| 2019 | $1,151 | $35,245 | $3,150 | $32,095 |
| 2018 | $1,177 | $35,245 | $3,150 | $32,095 |
| 2017 | $977 | $27,335 | $3,150 | $24,185 |
| 2016 | $938 | $27,340 | $3,150 | $24,190 |
| 2015 | $964 | $27,340 | $3,150 | $24,190 |
| 2013 | $1,038 | $27,340 | $3,150 | $24,190 |
Source: Public Records
Map
Nearby Homes
- 243 Mill St
- 227 Bridge St
- 512 North St
- 606 Main St
- 134 Main St
- 307 Harris St
- 524 Spring St
- 3100 Durant Rd
- 3345 Durant Rd
- 0 Durant Rd Unit 5186947
- 4145 Old River Rd
- 0 Sealover Hollow Rd
- 1685 Fattler Ridge Rd
- 6965 Chandlersville Rd
- 2519 Frick Dr
- 7979 Old River Rd
- 2630 Glenn Cir
- 3010 Corbin Dr
- 3010 S River Rd
- 8285 Old River Rd
Your Personal Tour Guide
Ask me questions while you tour the home.