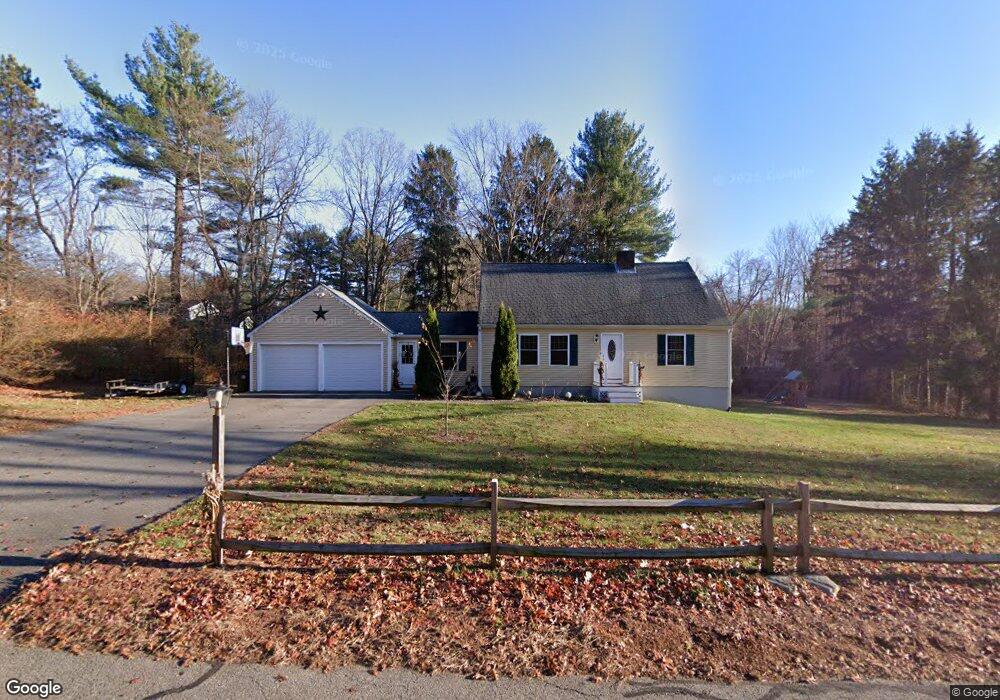
300 Millham St Marlborough, MA 01752
Estimated Value: $538,000 - $680,000
4
Beds
3
Baths
2,100
Sq Ft
$303/Sq Ft
Est. Value
About This Home
This home is located at 300 Millham St, Marlborough, MA 01752 and is currently estimated at $636,262, approximately $302 per square foot. 300 Millham St is a home located in Middlesex County with nearby schools including Marlborough High School, Advanced Math & Science Academy, and St. Bernadette School.
Ownership History
Date
Name
Owned For
Owner Type
Purchase Details
Closed on
Mar 6, 2023
Sold by
Wharff Sheryl A and Wharff Conray H
Bought by
Conray H Wharff Jr Ret
Current Estimated Value
Purchase Details
Closed on
Apr 8, 2010
Sold by
Hillcoat Susan M
Bought by
Wharff Conray H and Wharff Sheryl A
Purchase Details
Closed on
Feb 1, 1999
Sold by
Est Smith Barbara A and Choiniere Dolores A
Bought by
Hillcoat James M and Hillcoat Susan M
Home Financials for this Owner
Home Financials are based on the most recent Mortgage that was taken out on this home.
Original Mortgage
$143,500
Interest Rate
6.67%
Mortgage Type
Purchase Money Mortgage
Create a Home Valuation Report for This Property
The Home Valuation Report is an in-depth analysis detailing your home's value as well as a comparison with similar homes in the area
Home Values in the Area
Average Home Value in this Area
Purchase History
| Date | Buyer | Sale Price | Title Company |
|---|---|---|---|
| Conray H Wharff Jr Ret | -- | None Available | |
| Wharff Conray H | $212,000 | -- | |
| Hillcoat James M | $148,000 | -- |
Source: Public Records
Mortgage History
| Date | Status | Borrower | Loan Amount |
|---|---|---|---|
| Previous Owner | Hillcoat James M | $143,500 | |
| Previous Owner | Hillcoat James M | $9,600 |
Source: Public Records
Tax History Compared to Growth
Tax History
| Year | Tax Paid | Tax Assessment Tax Assessment Total Assessment is a certain percentage of the fair market value that is determined by local assessors to be the total taxable value of land and additions on the property. | Land | Improvement |
|---|---|---|---|---|
| 2025 | $5,533 | $561,200 | $231,200 | $330,000 |
| 2024 | $5,352 | $522,700 | $210,200 | $312,500 |
| 2023 | $5,580 | $483,500 | $181,700 | $301,800 |
| 2022 | $5,226 | $405,600 | $173,000 | $232,600 |
| 2021 | $5,226 | $378,700 | $144,200 | $234,500 |
| 2020 | $4,939 | $348,300 | $137,400 | $210,900 |
| 2019 | $4,815 | $342,200 | $134,700 | $207,500 |
| 2018 | $5,959 | $324,100 | $118,000 | $206,100 |
| 2017 | $4,899 | $305,700 | $117,600 | $188,100 |
| 2016 | $4,643 | $302,700 | $117,600 | $185,100 |
| 2015 | $4,589 | $291,200 | $120,700 | $170,500 |
Source: Public Records
Map
Nearby Homes