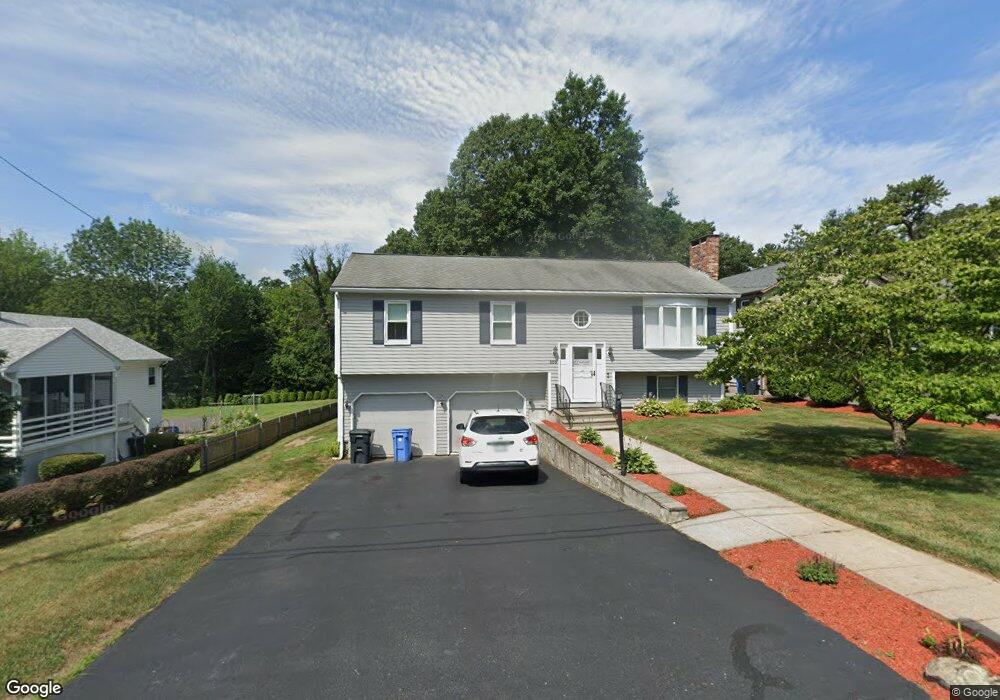
300 Morris St Cumberland, RI 02864
Monastery Heights NeighborhoodEstimated Value: $456,000 - $517,000
3
Beds
2
Baths
1,794
Sq Ft
$277/Sq Ft
Est. Value
About This Home
This home is located at 300 Morris St, Cumberland, RI 02864 and is currently estimated at $497,064, approximately $277 per square foot. 300 Morris St is a home located in Providence County with nearby schools including Garvin Memorial School, Joseph L. McCourt Middle School, and Cumberland High School.
Ownership History
Date
Name
Owned For
Owner Type
Purchase Details
Closed on
Oct 12, 1999
Sold by
Wallace Thomas J
Bought by
Ryan Thomas F and Ryan Deborah A
Current Estimated Value
Purchase Details
Closed on
Jun 17, 1997
Sold by
Carnes Paul A and Carnes Loretta
Bought by
Wallace Thomas J
Create a Home Valuation Report for This Property
The Home Valuation Report is an in-depth analysis detailing your home's value as well as a comparison with similar homes in the area
Home Values in the Area
Average Home Value in this Area
Purchase History
| Date | Buyer | Sale Price | Title Company |
|---|---|---|---|
| Ryan Thomas F | $157,000 | -- | |
| Wallace Thomas J | $137,000 | -- |
Source: Public Records
Mortgage History
| Date | Status | Borrower | Loan Amount |
|---|---|---|---|
| Closed | Wallace Thomas J | $129,000 | |
| Closed | Wallace Thomas J | $50,000 | |
| Closed | Wallace Thomas J | $138,000 |
Source: Public Records
Tax History
| Year | Tax Paid | Tax Assessment Tax Assessment Total Assessment is a certain percentage of the fair market value that is determined by local assessors to be the total taxable value of land and additions on the property. | Land | Improvement |
|---|---|---|---|---|
| 2025 | $5,088 | $414,700 | $149,400 | $265,300 |
| 2024 | $4,956 | $414,700 | $149,400 | $265,300 |
| 2023 | $4,819 | $414,700 | $149,400 | $265,300 |
| 2022 | $4,738 | $316,100 | $104,400 | $211,700 |
| 2021 | $4,659 | $316,100 | $104,400 | $211,700 |
| 2020 | $4,527 | $316,100 | $104,400 | $211,700 |
| 2019 | $4,437 | $279,400 | $87,200 | $192,200 |
| 2018 | $4,308 | $279,400 | $87,200 | $192,200 |
| 2017 | $4,250 | $279,400 | $87,200 | $192,200 |
| 2016 | $3,911 | $229,000 | $79,500 | $149,500 |
| 2015 | $3,911 | $229,000 | $79,500 | $149,500 |
| 2014 | $3,911 | $229,000 | $79,500 | $149,500 |
| 2013 | $3,850 | $244,000 | $79,100 | $164,900 |
Source: Public Records
Map
Nearby Homes
- 163 Woodside Ave
- 789 High St
- 27 Norman St
- 202 Marshall Ave
- 11 Woodside Ave
- 60 Highland Ave
- 15 Susan Dr
- 33 Kent St
- 98 Iroquois Rd
- 136 Roland St
- 50 Blackstone St
- 24 Narragansett Ave
- 0 Narragansett Rd
- 1551 Diamond Hill Rd
- 18 Narragansett Ave
- 51 Pequot Ave
- 311 High St
- 15 E Earle St
- 500 Mendon Rd Unit 320
- 36 Dexter St
Your Personal Tour Guide
Ask me questions while you tour the home.