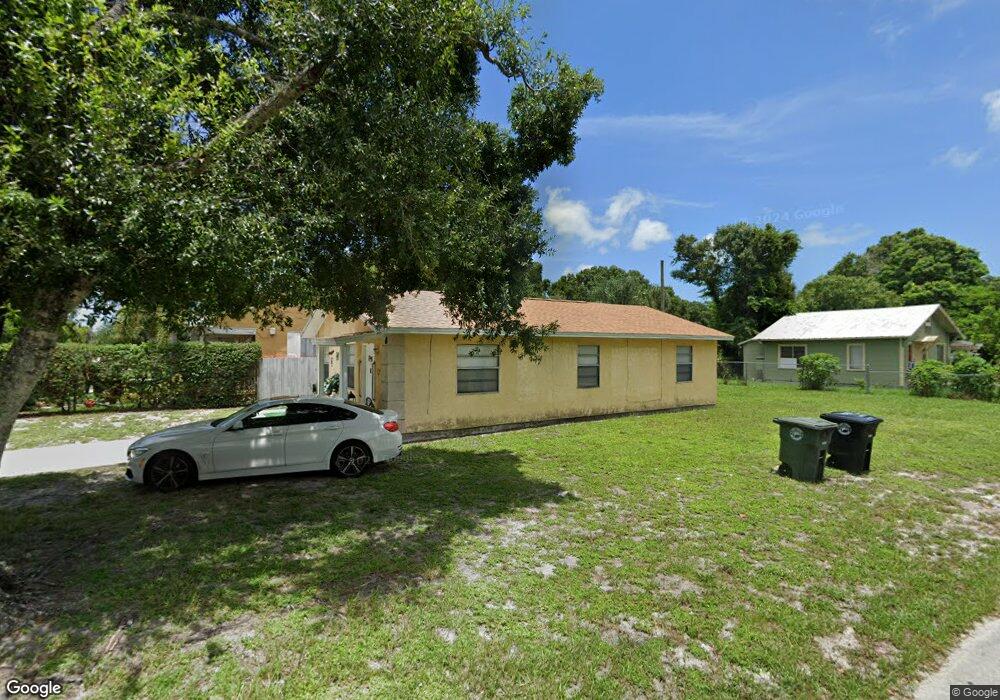
300 N 22nd St Fort Pierce, FL 34950
Estimated Value: $160,074 - $211,000
2
Beds
1
Bath
960
Sq Ft
$196/Sq Ft
Est. Value
About This Home
This home is located at 300 N 22nd St, Fort Pierce, FL 34950 and is currently estimated at $188,519, approximately $196 per square foot. 300 N 22nd St is a home located in St. Lucie County with nearby schools including Chester A. Moore Elementary School, Lawnwood Elementary School, and St. Lucie Elementary School.
Ownership History
Date
Name
Owned For
Owner Type
Purchase Details
Closed on
Mar 3, 2012
Sold by
Ingram Clarence
Bought by
Ingram Clarence and Avant Yolanda
Current Estimated Value
Purchase Details
Closed on
Nov 12, 2004
Sold by
Ingram Clarence and Ingram Ann
Bought by
Ingram Clarence and Ingram Ann
Home Financials for this Owner
Home Financials are based on the most recent Mortgage that was taken out on this home.
Original Mortgage
$64,000
Interest Rate
5.77%
Mortgage Type
Purchase Money Mortgage
Purchase Details
Closed on
Apr 13, 1999
Sold by
Lee Lucy Mae
Bought by
Ingram Clarence
Create a Home Valuation Report for This Property
The Home Valuation Report is an in-depth analysis detailing your home's value as well as a comparison with similar homes in the area
Home Values in the Area
Average Home Value in this Area
Purchase History
| Date | Buyer | Sale Price | Title Company |
|---|---|---|---|
| Ingram Clarence | -- | None Available | |
| Ingram Clarence | $11,600 | First American Title Ins Co | |
| Ingram Clarence | $11,500 | -- |
Source: Public Records
Mortgage History
| Date | Status | Borrower | Loan Amount |
|---|---|---|---|
| Closed | Ingram Clarence | $64,000 |
Source: Public Records
Tax History Compared to Growth
Tax History
| Year | Tax Paid | Tax Assessment Tax Assessment Total Assessment is a certain percentage of the fair market value that is determined by local assessors to be the total taxable value of land and additions on the property. | Land | Improvement |
|---|---|---|---|---|
| 2024 | $1,972 | $131,900 | $45,800 | $86,100 |
| 2023 | $1,972 | $130,500 | $47,700 | $82,800 |
| 2022 | $1,710 | $102,900 | $35,100 | $67,800 |
| 2021 | $1,484 | $74,500 | $14,000 | $60,500 |
| 2020 | $1,353 | $64,600 | $7,800 | $56,800 |
| 2019 | $1,319 | $68,200 | $7,800 | $60,400 |
| 2018 | $1,090 | $53,800 | $5,800 | $48,000 |
| 2017 | $988 | $45,900 | $4,300 | $41,600 |
| 2016 | $904 | $40,300 | $4,100 | $36,200 |
| 2015 | $776 | $27,600 | $3,500 | $24,100 |
| 2014 | $701 | $25,400 | $0 | $0 |
Source: Public Records
Map
Nearby Homes