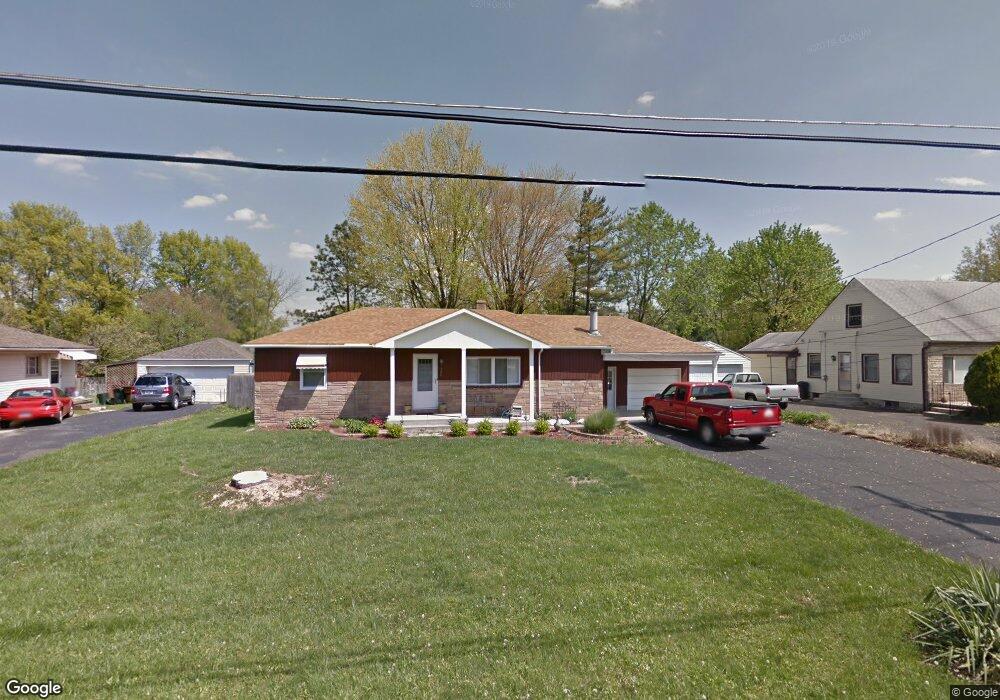
300 N Grener Ave Columbus, OH 43228
Estimated Value: $203,000 - $252,000
3
Beds
2
Baths
1,216
Sq Ft
$187/Sq Ft
Est. Value
About This Home
This home is located at 300 N Grener Ave, Columbus, OH 43228 and is currently estimated at $227,921, approximately $187 per square foot. 300 N Grener Ave is a home located in Franklin County with nearby schools including Prairie Lincoln Elementary School, Galloway Ridge Intermediate School, and Norton Middle School.
Ownership History
Date
Name
Owned For
Owner Type
Purchase Details
Closed on
Dec 5, 2017
Sold by
Harman Lucreasey and Harman Jim C
Bought by
Mason Paula L
Current Estimated Value
Home Financials for this Owner
Home Financials are based on the most recent Mortgage that was taken out on this home.
Original Mortgage
$123,717
Outstanding Balance
$105,663
Interest Rate
4.87%
Mortgage Type
FHA
Estimated Equity
$122,258
Purchase Details
Closed on
Mar 29, 2001
Sold by
Mcmillen Scott Allan
Bought by
Mcmillen Scott Allan and Mcmillen Lucreasey
Purchase Details
Closed on
Oct 4, 1994
Sold by
Riggleman Eugene K
Bought by
Mcmillen Scott A and Mcmillen Lucreasey
Home Financials for this Owner
Home Financials are based on the most recent Mortgage that was taken out on this home.
Original Mortgage
$75,050
Interest Rate
8.6%
Mortgage Type
New Conventional
Create a Home Valuation Report for This Property
The Home Valuation Report is an in-depth analysis detailing your home's value as well as a comparison with similar homes in the area
Home Values in the Area
Average Home Value in this Area
Purchase History
| Date | Buyer | Sale Price | Title Company |
|---|---|---|---|
| Mason Paula L | $126,000 | Patriot Title | |
| Mcmillen Scott Allan | -- | -- | |
| Mcmillen Scott A | $79,000 | -- |
Source: Public Records
Mortgage History
| Date | Status | Borrower | Loan Amount |
|---|---|---|---|
| Open | Mason Paula L | $123,717 | |
| Previous Owner | Mcmillen Scott A | $75,050 |
Source: Public Records
Tax History
| Year | Tax Paid | Tax Assessment Tax Assessment Total Assessment is a certain percentage of the fair market value that is determined by local assessors to be the total taxable value of land and additions on the property. | Land | Improvement |
|---|---|---|---|---|
| 2025 | $3,226 | $70,920 | $16,000 | $54,920 |
| 2024 | $3,226 | $70,920 | $16,000 | $54,920 |
| 2023 | $3,079 | $70,910 | $15,995 | $54,915 |
| 2022 | $2,517 | $40,640 | $6,130 | $34,510 |
| 2021 | $2,558 | $40,640 | $6,130 | $34,510 |
| 2020 | $2,546 | $40,640 | $6,130 | $34,510 |
| 2019 | $2,484 | $34,620 | $5,110 | $29,510 |
| 2018 | $2,319 | $34,620 | $5,110 | $29,510 |
| 2017 | $2,346 | $34,620 | $5,110 | $29,510 |
| 2016 | $2,162 | $29,090 | $6,370 | $22,720 |
| 2015 | $2,162 | $29,090 | $6,370 | $22,720 |
| 2014 | $2,126 | $29,090 | $6,370 | $22,720 |
| 2013 | $1,259 | $34,230 | $7,490 | $26,740 |
Source: Public Records
Map
Nearby Homes
- 404 Old Village Rd
- 218 Darbyhurst Rd
- 480 Yarmouth Ln
- 399 Carilla Ln
- 129 Beacon Run W Unit 21C
- 417 Revere Ct
- 4723 Tarryton Ct S Unit 14-E
- 87 Tarryton Ct W Unit 18D
- 463 Darbyhurst Rd
- 4647 Henley Ave
- 4682 Arnold Ave
- 102 Redmond Rd
- 4743 Stiles Ave
- 299 Lombard Rd
- 89 Postle Blvd
- 396 Pasadena Ave
- 110 Inah Ave
- 381 Pasadena Ave
- 154 Maple Dr
- 415 Georgesville Rd
- 278 N Grener Ave
- 304 N Grener Ave
- 0 N Grener Ave
- 270 N Grener Ave
- 310 N Grener Ave
- 285 N Grener Ave
- 281 N Grener Ave
- 305 N Grener Ave
- 260 N Grener Ave
- 271 N Grener Ave
- 320 N Grener Ave
- 261 N Grener Ave
- 321 N Grener Ave
- 250 N Grener Ave
- 326 N Grener Ave
- 325 N Grener Ave
- 251 N Grener Ave
- 240 N Grener Ave
- 341 N Grener Ave
- 235 N Grener Ave
Your Personal Tour Guide
Ask me questions while you tour the home.