300 North Dr Franklin, IN 46131
Estimated Value: $313,117 - $385,000
2
Beds
1
Bath
1,680
Sq Ft
$200/Sq Ft
Est. Value
About This Home
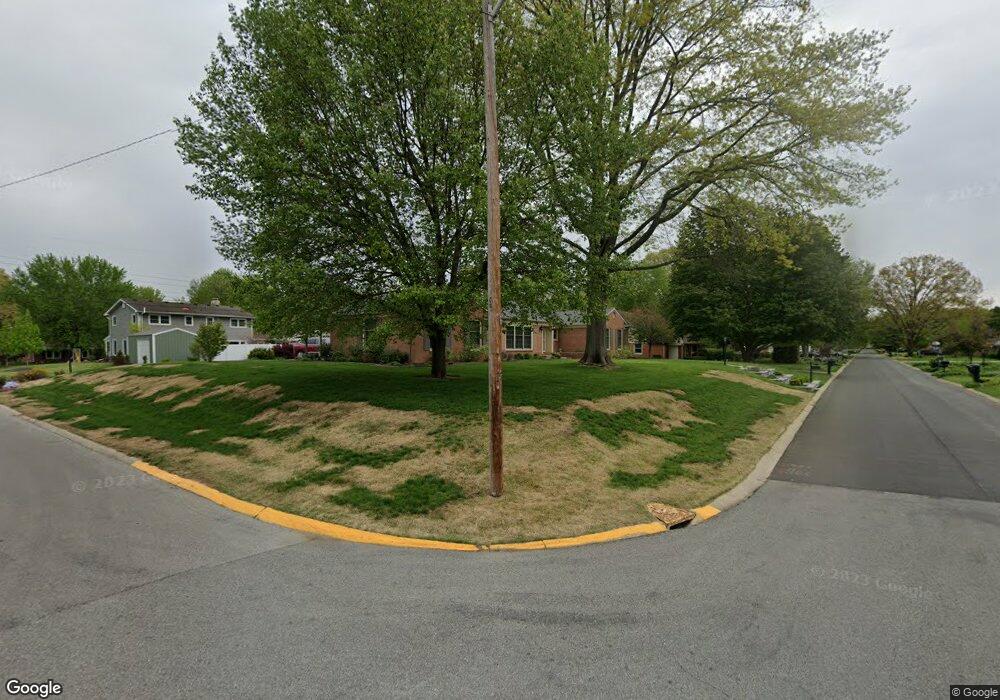
This home is located at 300 North Dr, Franklin, IN 46131 and is currently estimated at $336,279, approximately $200 per square foot. 300 North Dr is a home located in Johnson County with nearby schools including Union Elementary School, Custer Baker Intermediate School, and Franklin Community Middle School.
Ownership History
Date
Name
Owned For
Owner Type
Purchase Details
Closed on
Apr 27, 2022
Sold by
Stonebrook Of Franklin Apartments Llc
Bought by
New Stonebrook Llc
Current Estimated Value
Home Financials for this Owner
Home Financials are based on the most recent Mortgage that was taken out on this home.
Original Mortgage
$3,015,000
Outstanding Balance
$2,860,565
Interest Rate
5.11%
Mortgage Type
New Conventional
Estimated Equity
-$2,524,286
Purchase Details
Closed on
Sep 22, 2017
Sold by
Plank Rd Duplexes Llc
Bought by
Stonebrook Of Franklin Apartments Llc
Home Financials for this Owner
Home Financials are based on the most recent Mortgage that was taken out on this home.
Original Mortgage
$1,899,000
Interest Rate
3.89%
Mortgage Type
Commercial
Purchase Details
Closed on
Nov 10, 2008
Sold by
Ennis Company Inc
Bought by
Tri Yf Partnership
Create a Home Valuation Report for This Property
The Home Valuation Report is an in-depth analysis detailing your home's value as well as a comparison with similar homes in the area
Home Values in the Area
Average Home Value in this Area
Purchase History
| Date | Buyer | Sale Price | Title Company |
|---|---|---|---|
| New Stonebrook Llc | -- | Kutak Rock Lllp | |
| Stonebrook Of Franklin Apartments Llc | -- | First American Title | |
| Tri Yf Partnership | -- | None Available |
Source: Public Records
Mortgage History
| Date | Status | Borrower | Loan Amount |
|---|---|---|---|
| Open | New Stonebrook Llc | $3,015,000 | |
| Previous Owner | Stonebrook Of Franklin Apartments Llc | $1,899,000 |
Source: Public Records
Tax History
| Year | Tax Paid | Tax Assessment Tax Assessment Total Assessment is a certain percentage of the fair market value that is determined by local assessors to be the total taxable value of land and additions on the property. | Land | Improvement |
|---|---|---|---|---|
| 2025 | $7,177 | $234,300 | $21,800 | $212,500 |
| 2024 | $7,177 | $324,400 | $21,800 | $302,600 |
| 2023 | $2,946 | $132,400 | $21,800 | $110,600 |
| 2022 | $2,953 | $132,400 | $21,800 | $110,600 |
| 2021 | $2,953 | $132,400 | $21,800 | $110,600 |
| 2020 | $2,953 | $132,400 | $21,800 | $110,600 |
| 2019 | $2,953 | $132,400 | $17,200 | $115,200 |
| 2018 | $2,756 | $137,800 | $17,200 | $120,600 |
| 2017 | $2,756 | $137,800 | $17,200 | $120,600 |
| 2016 | $2,756 | $137,800 | $17,200 | $120,600 |
| 2014 | $2,756 | $137,800 | $17,200 | $120,600 |
| 2013 | $2,756 | $137,800 | $17,200 | $120,600 |
Source: Public Records
Map
Nearby Homes
- 173 Jacinta Place
- 159 Village Rd
- 41 N Wagon Rd
- 1023 Quarterhorse Run
- 77 S Tresslar Ave
- 350 North St
- 3527 Brunstfield Ct
- 3533 Brunstfield Ct
- 2032 Partridge Dr
- 3201 Heather Dr
- 3217 Heather Dr
- 4 Westview Place
- 3265 Heather Dr
- 3281 Heather Dr
- 3232 Heather Dr
- 3628 Hauser Ct
- 3151 Wrangler Dr
- 3636 Hauser Ct
- 3231 Wrangler Dr
- 3247 Wrangler Dr
- 300 North Dr
- 300 North Dr
- 300 North Dr
- 300 North Dr
- 300 North Dr
- 300 North Dr
- 300 North Dr
- 300 North Dr
- 300 North Dr
- 628 Old Plank Rd
- 616 Old Plank Rd
- 596 Old Plank Rd
- 644 Old Plank Rd
- 695 E Old St S
- 695 E Old South St
- 447 E Old Plank Rd
- 000 E Old Plank Rd
- 00 E Old Plank Rd
- 586 Old Plank Rd
- 2961 W 300 N
Your Personal Tour Guide
Ask me questions while you tour the home.