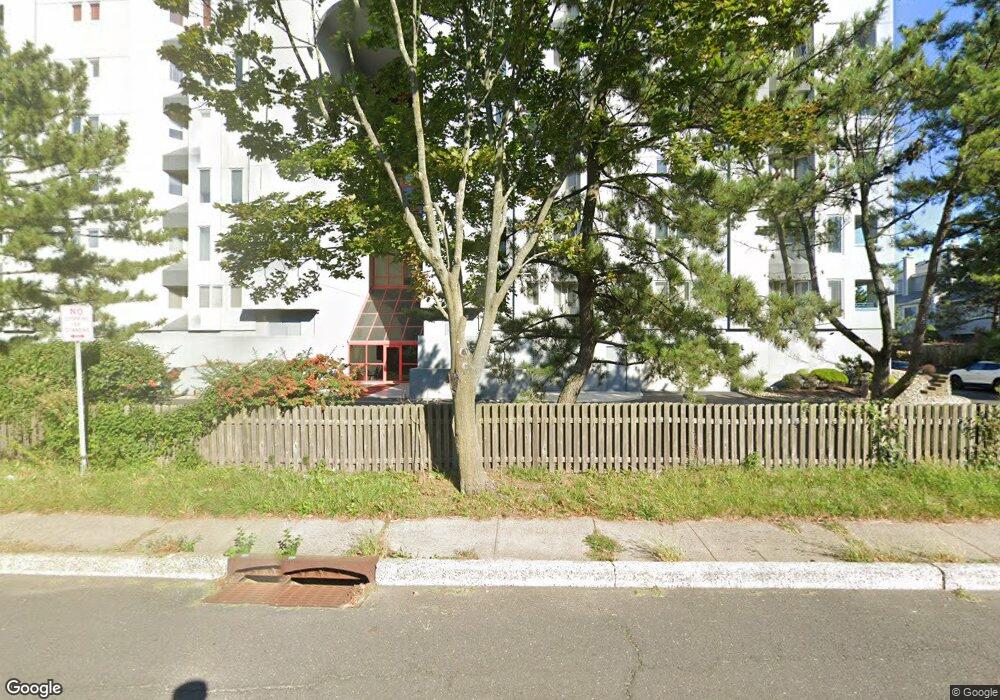
300 Ocean Ave N Unit 5C Long Branch, NJ 07740
Estimated Value: $944,000 - $1,062,000
2
Beds
1
Bath
2,439
Sq Ft
$419/Sq Ft
Est. Value
About This Home
This home is located at 300 Ocean Ave N Unit 5C, Long Branch, NJ 07740 and is currently estimated at $1,021,025, approximately $418 per square foot. 300 Ocean Ave N Unit 5C is a home located in Monmouth County with nearby schools including Long Branch High School and Holy Trinity School.
Ownership History
Date
Name
Owned For
Owner Type
Purchase Details
Closed on
Feb 9, 2021
Sold by
Dorney James
Bought by
Ferro Nicole
Current Estimated Value
Home Financials for this Owner
Home Financials are based on the most recent Mortgage that was taken out on this home.
Original Mortgage
$630,000
Outstanding Balance
$563,466
Interest Rate
2.7%
Mortgage Type
New Conventional
Estimated Equity
$457,559
Purchase Details
Closed on
Jul 28, 2006
Sold by
Scott Marjory A
Bought by
Dorney James
Home Financials for this Owner
Home Financials are based on the most recent Mortgage that was taken out on this home.
Original Mortgage
$390,000
Interest Rate
6.7%
Purchase Details
Closed on
Sep 1, 1998
Sold by
Ggo Gregory
Bought by
Scott Marjory
Home Financials for this Owner
Home Financials are based on the most recent Mortgage that was taken out on this home.
Original Mortgage
$75,000
Interest Rate
6.9%
Create a Home Valuation Report for This Property
The Home Valuation Report is an in-depth analysis detailing your home's value as well as a comparison with similar homes in the area
Home Values in the Area
Average Home Value in this Area
Purchase History
| Date | Buyer | Sale Price | Title Company |
|---|---|---|---|
| Ferro Nicole | $630,000 | All Ahead Title Agency | |
| Ferro Nicole | $630,000 | All Ahead Title | |
| Dorney James | $779,900 | -- | |
| Scott Marjory | $210,000 | -- |
Source: Public Records
Mortgage History
| Date | Status | Borrower | Loan Amount |
|---|---|---|---|
| Open | Ferro Nicole | $630,000 | |
| Closed | Ferro Nicole | $630,000 | |
| Previous Owner | Dorney James | $390,000 | |
| Previous Owner | Scott Marjory | $75,000 |
Source: Public Records
Tax History Compared to Growth
Tax History
| Year | Tax Paid | Tax Assessment Tax Assessment Total Assessment is a certain percentage of the fair market value that is determined by local assessors to be the total taxable value of land and additions on the property. | Land | Improvement |
|---|---|---|---|---|
| 2025 | $12,354 | $849,700 | $406,600 | $443,100 |
| 2024 | $11,685 | $803,800 | $379,900 | $423,900 |
| 2023 | $11,685 | $752,400 | $347,800 | $404,600 |
| 2022 | $11,830 | $630,300 | $273,900 | $356,400 |
| 2021 | $11,830 | $591,200 | $257,900 | $333,300 |
| 2020 | $12,517 | $598,900 | $267,500 | $331,400 |
| 2019 | $11,372 | $541,000 | $225,000 | $316,000 |
| 2018 | $11,192 | $529,400 | $225,000 | $304,400 |
| 2017 | $10,791 | $523,600 | $225,000 | $298,600 |
| 2016 | $10,426 | $515,900 | $225,000 | $290,900 |
| 2015 | $11,019 | $494,800 | $180,000 | $314,800 |
| 2014 | $12,414 | $587,500 | $193,900 | $393,600 |
Source: Public Records
Map
Nearby Homes
- 432 Ocean Blvd N Unit 506
- 432 Ocean Blvd N Unit 118
- 432 Ocean Blvd N Unit 315
- 432 Ocean Blvd Unit 208
- 422 Ocean Blvd N Unit 5H
- 200 Ocean Ave N Unit 13
- 200 Ocean Ave N Unit 19
- 129 Joline Ave
- 231 Long Branch Ave
- 56 Seaview Ave
- 18 Seaview Ave
- 40 Seaview Ave Unit A
- 172 Chelton Ave
- 78 Ocean Terrace
- 342 Macarthur Ave
- 179 Joline Ave
- 188 Chelton Ave
- 323 Florence Ave
- 33 Cooper Ave Unit 213
- 22 Cooper Ave Unit 309
- 300 Ocean Ave N Unit 5B
- 300 Ocean Ave N Unit 6B
- 300 Ocean Ave N Unit 6A
- 300 Ocean Ave N Unit 3C
- 300 Ocean Ave N Unit 2C
- 300 Ocean Ave N Unit 3B
- 300 Ocean Ave N Unit 6C
- 300 Ocean Ave N Unit 2B
- 300 Ocean Ave N Unit 4A
- 300 Ocean Ave N Unit 2A
- 300 Ocean Ave N Unit 4B
- 300 Ocean Ave N Unit 1C
- 300 Ocean Ave N Unit 3A
- 300 Ocean Ave N Unit 3D
- 300 Ocean Ave N Unit 4C
- 300 Ocean Ave N Unit 5D
- 300 Ocean Ave N Unit 4D
- 300 Ocean Ave N Unit 6D
- 300 Ocean Ave N Unit 5A
- 300 Ocean Ave N Unit 2D