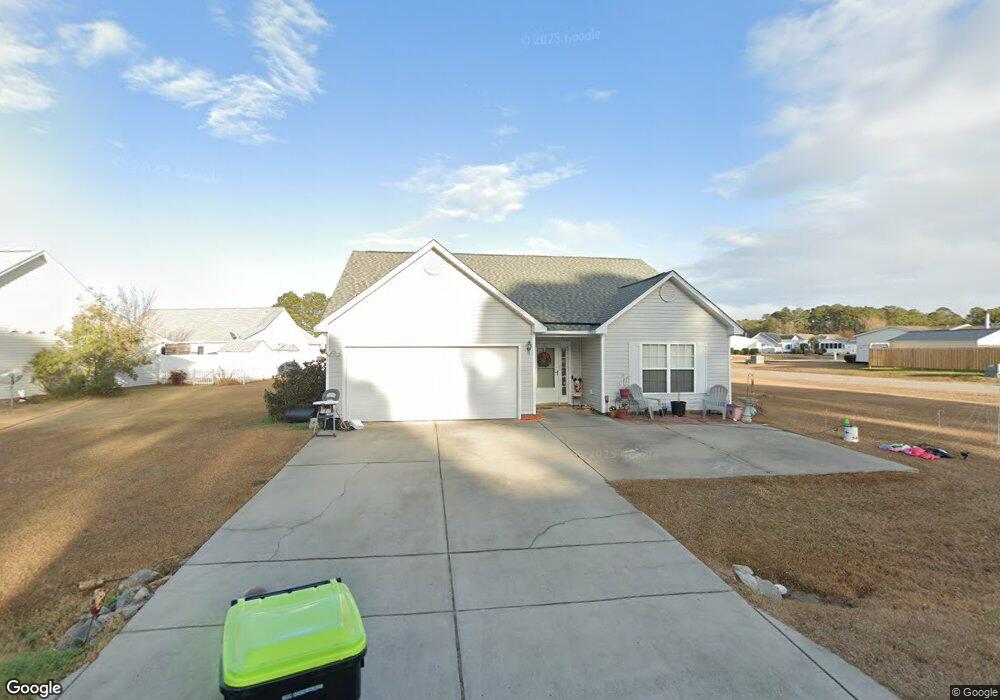
300 Opal Ave Unit LR Little River, SC 29566
Estimated Value: $309,000 - $323,000
3
Beds
2
Baths
1,575
Sq Ft
$200/Sq Ft
Est. Value
About This Home
This home is located at 300 Opal Ave Unit LR, Little River, SC 29566 and is currently estimated at $314,807, approximately $199 per square foot. 300 Opal Ave Unit LR is a home located in Horry County with nearby schools including Waterway Elementary School, North Myrtle Beach Middle School, and North Myrtle Beach High School.
Ownership History
Date
Name
Owned For
Owner Type
Purchase Details
Closed on
Jul 20, 2023
Sold by
Pesce Christopher
Bought by
Patterson Victoria M
Current Estimated Value
Purchase Details
Closed on
Apr 4, 2022
Sold by
Pesce Josephine
Bought by
Pesce Christopher
Purchase Details
Closed on
Dec 5, 2008
Sold by
Federal National Mortgage Association
Bought by
Pesce Frank
Purchase Details
Closed on
Jul 30, 2008
Sold by
Master In Equity Horry County
Bought by
Federal National Mortgage Association
Purchase Details
Closed on
May 19, 2006
Sold by
Piedmont Companies Inc
Bought by
Ashley Turner Building Co
Purchase Details
Closed on
Dec 17, 2003
Sold by
Stones Edge Of Horry County Llc
Bought by
Piedmont Companies Inc
Purchase Details
Closed on
Jul 13, 2000
Sold by
Stones Edge Associates Llc
Bought by
Stones Edge Of Horry County Llc
Purchase Details
Closed on
Jun 30, 1999
Sold by
Stones Edge Llc
Bought by
Stones Edge Associates Llc
Create a Home Valuation Report for This Property
The Home Valuation Report is an in-depth analysis detailing your home's value as well as a comparison with similar homes in the area
Home Values in the Area
Average Home Value in this Area
Purchase History
| Date | Buyer | Sale Price | Title Company |
|---|---|---|---|
| Patterson Victoria M | $230,000 | -- | |
| Pesce Christopher | -- | -- | |
| Pesce Frank | -- | -- | |
| Federal National Mortgage Association | $171,472 | -- | |
| Ashley Turner Building Co | $96,000 | None Available | |
| Piedmont Companies Inc | $11,077,050 | -- | |
| Stones Edge Of Horry County Llc | $1,336,500 | -- | |
| Stones Edge Associates Llc | $1,295,000 | -- |
Source: Public Records
Tax History Compared to Growth
Tax History
| Year | Tax Paid | Tax Assessment Tax Assessment Total Assessment is a certain percentage of the fair market value that is determined by local assessors to be the total taxable value of land and additions on the property. | Land | Improvement |
|---|---|---|---|---|
| 2024 | $3,259 | $10,512 | $2,473 | $8,039 |
| 2023 | $3,259 | $6,519 | $1,255 | $5,264 |
| 2021 | $564 | $6,519 | $1,255 | $5,264 |
| 2020 | $481 | $6,519 | $1,255 | $5,264 |
| 2019 | $481 | $6,519 | $1,255 | $5,264 |
| 2018 | $572 | $6,258 | $1,246 | $5,012 |
| 2017 | $378 | $6,258 | $1,246 | $5,012 |
| 2016 | $0 | $6,258 | $1,246 | $5,012 |
| 2015 | -- | $6,258 | $1,246 | $5,012 |
| 2014 | $349 | $6,258 | $1,246 | $5,012 |
Source: Public Records
Map
Nearby Homes
- 2532 Stonesedge Blvd
- 317 Opal Ave
- 2425 Bittar Spar Rd
- 271 Sienna Dr
- 127 Ashworth Dr
- 121 Ashworth Dr
- 408 Alabaster Ct Unit Lot 39; Stones Edge
- 2501 Stonesedge Blvd
- 2744 Desert Rose St
- 2248 Seaford Dr
- 2216 Seaford Dr
- 509 Shellbank Dr Unit B
- 1274 Camlet Ln
- 2881 Desert Rose St
- 197 Northside Dr
- 2636 Brick Dr Unit Colonial Club Estate
- 180 Northside Dr
- 511 Colonial Trace Dr Unit 7-C
- 278 Carolina Crossing Blvd
- 241 Carolina Crossing Blvd
- 300 Opal Ave
- 302 Opal Ave
- 2537 Stonesedge Blvd
- 304 Opal Ave
- 301 Opal Ave
- 2541 Stonesedge Blvd
- 305 Opal Ave
- 205 Garnet Rd
- 308 Opal Ave
- 209 Garnet Rd
- 309 Opal Ave
- 2545 Stonesedge Blvd
- 211 Garnet Rd
- 2536 Stonesedge Blvd
- 312 Opal Ave
- 2545 Stones Edge Dr
- 2529 Stonesedge Blvd
- 2552 Stonesedge Blvd
- 2531 Stonesedge Blvd
- 313 Opal Ave