Estimated Value: $322,567 - $400,000
3
Beds
2
Baths
1,590
Sq Ft
$228/Sq Ft
Est. Value
About This Home
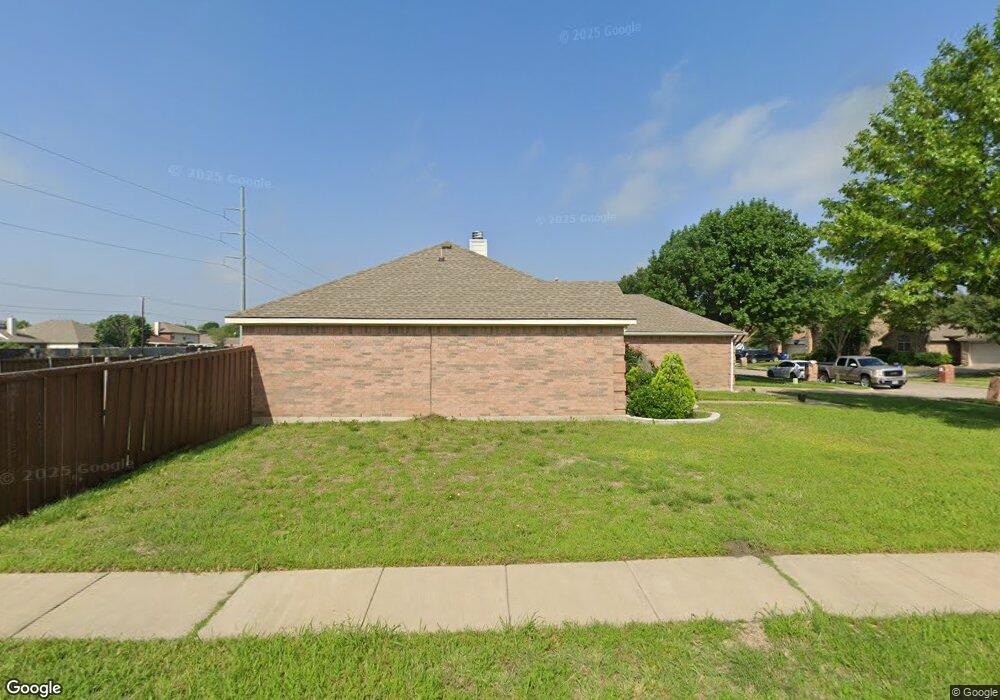
This home is located at 300 Orchard Trail, Wylie, TX 75098 and is currently estimated at $362,142, approximately $227 per square foot. 300 Orchard Trail is a home located in Collin County with nearby schools including T.F. Birmingham Elementary School, Frank Mcmillan Junior High School, and Davis Intermediate School.
Ownership History
Date
Name
Owned For
Owner Type
Purchase Details
Closed on
Nov 14, 2016
Sold by
Hackney Brain and Hackney Carla
Bought by
Jembere Solomon and Kebede Selamawit
Current Estimated Value
Home Financials for this Owner
Home Financials are based on the most recent Mortgage that was taken out on this home.
Original Mortgage
$204,723
Outstanding Balance
$163,470
Interest Rate
3.25%
Mortgage Type
FHA
Estimated Equity
$198,672
Purchase Details
Closed on
Mar 31, 2004
Sold by
Moldt Cynthia K
Bought by
Hackney Brian
Purchase Details
Closed on
Apr 30, 2003
Sold by
C & N Group Lp
Bought by
Moldt Cynthia K
Home Financials for this Owner
Home Financials are based on the most recent Mortgage that was taken out on this home.
Original Mortgage
$100,792
Interest Rate
4.5%
Mortgage Type
Purchase Money Mortgage
Create a Home Valuation Report for This Property
The Home Valuation Report is an in-depth analysis detailing your home's value as well as a comparison with similar homes in the area
Home Values in the Area
Average Home Value in this Area
Purchase History
| Date | Buyer | Sale Price | Title Company |
|---|---|---|---|
| Jembere Solomon | -- | None Available | |
| Hackney Brian | -- | -- | |
| Moldt Cynthia K | -- | Cltic |
Source: Public Records
Mortgage History
| Date | Status | Borrower | Loan Amount |
|---|---|---|---|
| Open | Jembere Solomon | $204,723 | |
| Previous Owner | Moldt Cynthia K | $100,792 | |
| Closed | Moldt Cynthia K | $12,599 |
Source: Public Records
Tax History Compared to Growth
Tax History
| Year | Tax Paid | Tax Assessment Tax Assessment Total Assessment is a certain percentage of the fair market value that is determined by local assessors to be the total taxable value of land and additions on the property. | Land | Improvement |
|---|---|---|---|---|
| 2025 | $4,908 | $323,026 | $94,500 | $228,526 |
| 2024 | $4,908 | $313,672 | $94,500 | $231,712 |
| 2023 | $4,908 | $285,156 | $105,000 | $218,254 |
| 2022 | $5,687 | $259,233 | $84,000 | $218,642 |
| 2021 | $5,545 | $235,666 | $73,500 | $162,166 |
| 2020 | $5,485 | $220,880 | $63,000 | $157,880 |
| 2019 | $5,932 | $225,743 | $63,000 | $162,743 |
| 2018 | $5,568 | $206,744 | $52,500 | $154,244 |
| 2017 | $5,315 | $197,374 | $52,500 | $144,874 |
| 2016 | $4,788 | $181,024 | $42,000 | $139,024 |
| 2015 | $3,776 | $156,797 | $36,750 | $120,047 |
Source: Public Records
Map
Nearby Homes
- 500 Parker Rd
- 550 Parker Rd
- 502 E Gaston Dr
- 121 Fairmount Dr
- 423 N Winding Oaks Dr
- 517 E Gaston Dr
- 410 N Winding Oaks Dr
- 415 Carver Dr
- 605 Graham Ct
- 7375 Moses Dr
- 309 Sikorsky Ct
- 1312 Meziere Sky Dr
- 307 W Brown St
- 705 Baldwin Rd
- 410 Oxford Dr
- 404 W Jefferson St
- 1403 Lakeview Dr
- 303 N 2nd St
- 713 Kinston Ct
- 1022 Debby Ct
- 302 Orchard Trail
- 210 Orchard Trail
- 304 Orchard Trail
- 306 Orchard Trail
- 301 Orchard Trail
- 208 Orchard Trail
- 303 Orchard Trail
- 207 Orchard Trail
- 305 Orchard Trail
- 308 Orchard Trail
- 307 Orchard Trail
- 206 Orchard Trail
- 301 Autumn Breeze Dr
- 303 Autumn Breeze Dr
- 205 Autumn Breeze Dr
- 309 Orchard Trail
- 305 Autumn Breeze Dr
- 310 Orchard Trail
- 203 Autumn Breeze Dr
- 204 Millstone Dr