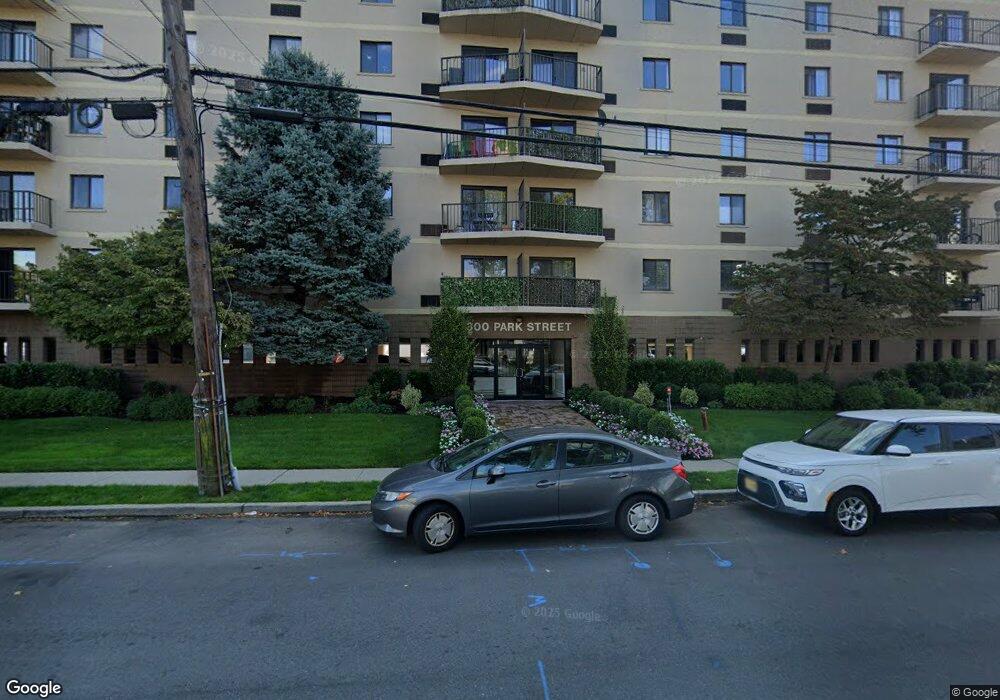
300 Park St Hackensack, NJ 07601
Estimated Value: $271,000 - $375,000
Studio
--
Bath
949
Sq Ft
$351/Sq Ft
Est. Value
About This Home
This home is located at 300 Park St, Hackensack, NJ 07601 and is currently estimated at $332,976, approximately $350 per square foot. 300 Park St is a home located in Bergen County with nearby schools including Hackensack High School and Bergen County Christian Academy.
Ownership History
Date
Name
Owned For
Owner Type
Purchase Details
Closed on
Jun 26, 2018
Sold by
Mtglq Investors Lp
Bought by
Davis Roselyn and Gomez Jonathan
Current Estimated Value
Home Financials for this Owner
Home Financials are based on the most recent Mortgage that was taken out on this home.
Original Mortgage
$169,750
Interest Rate
4.5%
Mortgage Type
Purchase Money Mortgage
Purchase Details
Closed on
Jan 23, 2018
Sold by
Saudino Michael
Bought by
Mtglq Investors Lp
Purchase Details
Closed on
Jan 22, 2004
Sold by
Sywilok John
Bought by
Raisor Aecha
Home Financials for this Owner
Home Financials are based on the most recent Mortgage that was taken out on this home.
Original Mortgage
$132,000
Interest Rate
5.82%
Purchase Details
Closed on
Jun 17, 1996
Sold by
Federal Deposit Insurance Corporation
Bought by
Martindale Eric and Martindale Jeonghee
Home Financials for this Owner
Home Financials are based on the most recent Mortgage that was taken out on this home.
Original Mortgage
$38,000
Interest Rate
8.28%
Create a Home Valuation Report for This Property
The Home Valuation Report is an in-depth analysis detailing your home's value as well as a comparison with similar homes in the area
Home Values in the Area
Average Home Value in this Area
Purchase History
| Date | Buyer | Sale Price | Title Company |
|---|---|---|---|
| Davis Roselyn | $179,900 | -- | |
| Mtglq Investors Lp | -- | -- | |
| Raisor Aecha | $165,000 | -- | |
| Martindale Eric | $40,000 | -- |
Source: Public Records
Mortgage History
| Date | Status | Borrower | Loan Amount |
|---|---|---|---|
| Previous Owner | Davis Roselyn | $169,750 | |
| Previous Owner | Raisor Aecha | $132,000 | |
| Previous Owner | Martindale Eric | $38,000 |
Source: Public Records
Tax History
| Year | Tax Paid | Tax Assessment Tax Assessment Total Assessment is a certain percentage of the fair market value that is determined by local assessors to be the total taxable value of land and additions on the property. | Land | Improvement |
|---|---|---|---|---|
| 2025 | $6,567 | $214,900 | $102,500 | $112,400 |
| 2024 | $6,187 | $214,900 | $102,500 | $112,400 |
| 2023 | $5,881 | $214,900 | $102,500 | $112,400 |
| 2022 | $5,881 | $209,900 | $97,500 | $112,400 |
| 2021 | $5,799 | $172,700 | $82,500 | $90,200 |
| 2020 | $5,715 | $172,700 | $82,500 | $90,200 |
| 2019 | $5,751 | $171,300 | $82,000 | $89,300 |
| 2018 | $5,823 | $170,600 | $81,500 | $89,100 |
| 2017 | $5,744 | $168,200 | $80,000 | $88,200 |
| 2016 | $5,314 | $157,300 | $70,000 | $87,300 |
| 2015 | $7,063 | $201,800 | $66,600 | $135,200 |
| 2014 | $6,704 | $201,800 | $66,600 | $135,200 |
Source: Public Records
Map
Nearby Homes
- 168 Clay St Unit 70
- 275 State St Unit 5B
- 433 Park St
- 72 Lawrence St
- 298 3rd St
- 5 Linden St Unit 3C
- 252 Berry St
- 160 Overlook Ave Unit 4C
- 150 Overlook Ave Unit 10H
- 150 Overlook Ave Unit 6H
- 150 Overlook Ave Unit 7F
- 150 Overlook Ave Unit 12E
- 395 2nd St
- 280 Prospect Ave Unit 9H
- 280 Prospect Ave Unit 11H
- 280 Prospect Ave Unit 3N
- 55 Clinton Place Unit 502
- 326 Prospect Ave Unit 8E
- 326 Prospect Ave Unit 6J
- 326 Prospect Ave Unit 12A
Your Personal Tour Guide
Ask me questions while you tour the home.