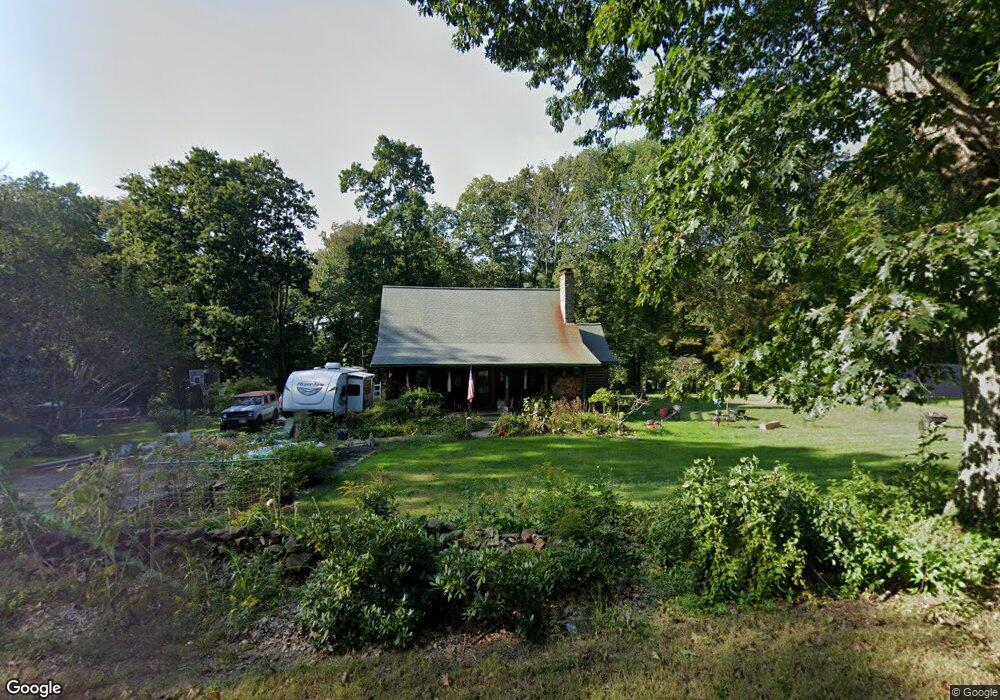
300 Ravine Rd New Braintree, MA 01531
Estimated Value: $444,000 - $504,000
3
Beds
2
Baths
1,707
Sq Ft
$272/Sq Ft
Est. Value
About This Home
This home is located at 300 Ravine Rd, New Braintree, MA 01531 and is currently estimated at $465,090, approximately $272 per square foot. 300 Ravine Rd is a home located in Worcester County with nearby schools including Quabbin Regional Middle School and Quabbin Regional High School.
Ownership History
Date
Name
Owned For
Owner Type
Purchase Details
Closed on
Jan 25, 2018
Sold by
Ryan Shawn E and Ryan Jennifer A
Bought by
Ryan Shawn E and Ryan Jennifer A
Current Estimated Value
Purchase Details
Closed on
Apr 24, 2006
Sold by
Ryan Shawn E
Bought by
Costigan Jennifer A and Ryan Shawn E
Purchase Details
Closed on
Sep 16, 1998
Sold by
Badgio James D
Bought by
Ryan Shawn E
Home Financials for this Owner
Home Financials are based on the most recent Mortgage that was taken out on this home.
Original Mortgage
$10,000
Interest Rate
6.9%
Mortgage Type
Purchase Money Mortgage
Create a Home Valuation Report for This Property
The Home Valuation Report is an in-depth analysis detailing your home's value as well as a comparison with similar homes in the area
Home Values in the Area
Average Home Value in this Area
Purchase History
| Date | Buyer | Sale Price | Title Company |
|---|---|---|---|
| Ryan Shawn E | -- | -- | |
| Costigan Jennifer A | -- | -- | |
| Ryan Shawn E | $20,000 | -- |
Source: Public Records
Mortgage History
| Date | Status | Borrower | Loan Amount |
|---|---|---|---|
| Previous Owner | Ryan Shawn E | $224,000 | |
| Previous Owner | Ryan Shawn E | $10,000 |
Source: Public Records
Tax History Compared to Growth
Tax History
| Year | Tax Paid | Tax Assessment Tax Assessment Total Assessment is a certain percentage of the fair market value that is determined by local assessors to be the total taxable value of land and additions on the property. | Land | Improvement |
|---|---|---|---|---|
| 2025 | $54 | $365,000 | $59,200 | $305,800 |
| 2024 | $5,307 | $365,000 | $59,200 | $305,800 |
| 2023 | $4,925 | $335,500 | $59,200 | $276,300 |
| 2022 | $4,366 | $268,700 | $47,000 | $221,700 |
| 2021 | $4,457 | $255,100 | $44,100 | $211,000 |
| 2020 | $4,342 | $250,700 | $44,100 | $206,600 |
| 2019 | $4,262 | $250,700 | $44,100 | $206,600 |
| 2018 | $4,176 | $237,800 | $47,100 | $190,700 |
| 2017 | $3,933 | $217,800 | $50,200 | $167,600 |
| 2016 | $3,562 | $204,700 | $50,200 | $154,500 |
| 2015 | $3,518 | $216,600 | $56,800 | $159,800 |
| 2014 | $3,539 | $216,600 | $56,800 | $159,800 |
Source: Public Records
Map
Nearby Homes