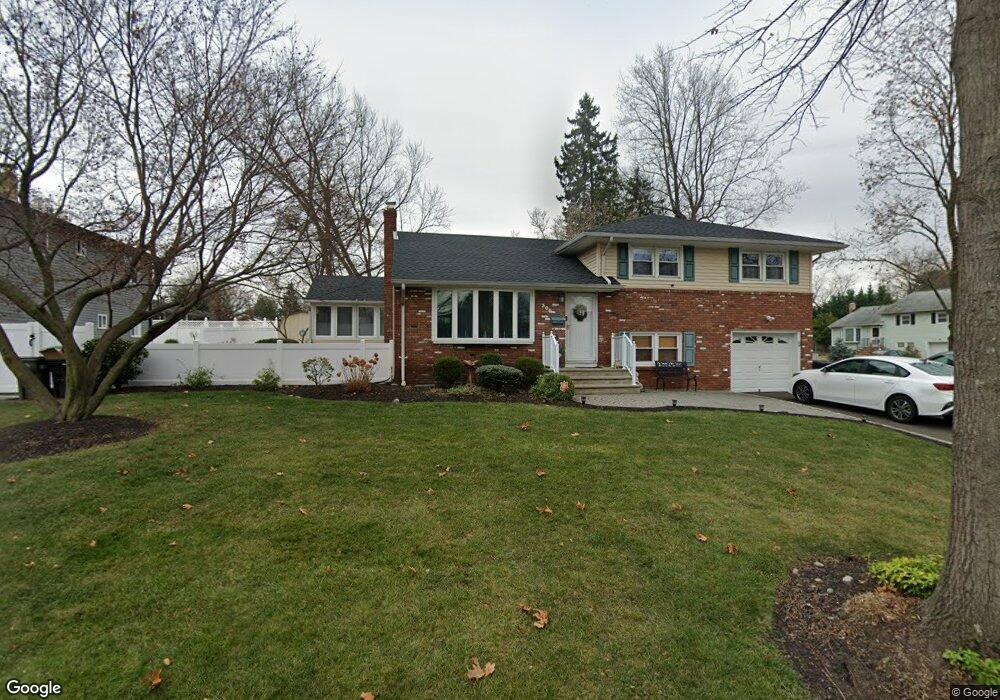
300 Redding Ave South Plainfield, NJ 07080
Estimated Value: $532,401 - $635,000
--
Bed
--
Bath
1,456
Sq Ft
$400/Sq Ft
Est. Value
About This Home
This home is located at 300 Redding Ave, South Plainfield, NJ 07080 and is currently estimated at $583,100, approximately $400 per square foot. 300 Redding Ave is a home located in Middlesex County with nearby schools including South Plainfield High School, Holy Savior Academy, and The Wardlaw-Hartridge School.
Ownership History
Date
Name
Owned For
Owner Type
Purchase Details
Closed on
Sep 29, 2005
Sold by
Stellakis Victor
Bought by
Torres Raymond and Torres Auruna
Current Estimated Value
Home Financials for this Owner
Home Financials are based on the most recent Mortgage that was taken out on this home.
Original Mortgage
$200,000
Outstanding Balance
$106,779
Interest Rate
5.72%
Mortgage Type
New Conventional
Estimated Equity
$476,321
Purchase Details
Closed on
Mar 15, 2002
Sold by
Morgan Charles
Bought by
Stellakis Victor and Stellakis Zinovia
Home Financials for this Owner
Home Financials are based on the most recent Mortgage that was taken out on this home.
Original Mortgage
$219,450
Interest Rate
6.85%
Purchase Details
Closed on
Jul 28, 1994
Sold by
Gold Susan
Bought by
Morgan Charles and Morgan Carolyn
Home Financials for this Owner
Home Financials are based on the most recent Mortgage that was taken out on this home.
Original Mortgage
$148,000
Interest Rate
8.65%
Mortgage Type
FHA
Create a Home Valuation Report for This Property
The Home Valuation Report is an in-depth analysis detailing your home's value as well as a comparison with similar homes in the area
Home Values in the Area
Average Home Value in this Area
Purchase History
| Date | Buyer | Sale Price | Title Company |
|---|---|---|---|
| Torres Raymond | $415,000 | -- | |
| Stellakis Victor | $231,000 | -- | |
| Morgan Charles | $155,000 | -- |
Source: Public Records
Mortgage History
| Date | Status | Borrower | Loan Amount |
|---|---|---|---|
| Open | Torres Raymond | $200,000 | |
| Previous Owner | Stellakis Victor | $219,450 | |
| Previous Owner | Morgan Charles | $148,000 |
Source: Public Records
Tax History Compared to Growth
Tax History
| Year | Tax Paid | Tax Assessment Tax Assessment Total Assessment is a certain percentage of the fair market value that is determined by local assessors to be the total taxable value of land and additions on the property. | Land | Improvement |
|---|---|---|---|---|
| 2025 | $8,923 | $127,800 | $35,500 | $92,300 |
| 2024 | $8,534 | $127,800 | $35,500 | $92,300 |
| 2023 | $8,534 | $127,800 | $35,500 | $92,300 |
| 2022 | $8,428 | $127,800 | $35,500 | $92,300 |
| 2021 | $8,230 | $127,800 | $35,500 | $92,300 |
| 2020 | $8,110 | $127,800 | $35,500 | $92,300 |
| 2019 | $7,782 | $127,800 | $35,500 | $92,300 |
| 2018 | $7,581 | $127,800 | $35,500 | $92,300 |
| 2017 | $7,484 | $127,800 | $35,500 | $92,300 |
| 2016 | $7,409 | $127,800 | $35,500 | $92,300 |
| 2015 | $7,281 | $127,800 | $35,500 | $92,300 |
| 2014 | $7,071 | $127,800 | $35,500 | $92,300 |
Source: Public Records
Map
Nearby Homes
- 1905 Park Ave
- 117 Golf Ave E
- 2415 Maple Ave
- 221 Golf Ave E
- 2715 Maple Ave
- 6 Stacey Ct
- 1388 Belleview Ave Unit 90
- 1349 Park Ave Unit 53
- 102 Jerome Ave
- 1339 Park Ave Unit 41
- 5 Old Raritan Rd
- 1454 S End Pkwy Unit 56
- 21 King St
- 1208 Moffett Ave Unit 12
- 533 Edgar Ave
- 77 Parkside Rd Unit 89
- 114 Whispering Hills Rd
- 127 Remington Ave Unit 31
- 132 Parkside Rd
- 1712 Kenyon Ave
- 306 Redding Ave
- 310 Redding Ave
- 1909 Audubon Ave
- 1926 Linden Ave
- 1908 Audubon Ave
- 129 Redding Ave
- 133 Redding Ave
- 1932 Linden Ave
- 1913 Audubon Ave
- 1916 Audubon Ave
- 315 Redding Ave
- 1923 Linden Ave
- 202 Redding Ave
- 123 Redding Ave
- 1905 Holly Ave
- 1927 Linden Ave
- 144 Fairmount Ave
- 142 Fairmount Ave
- 146 Fairmount Ave
- 1917 Audubon Ave