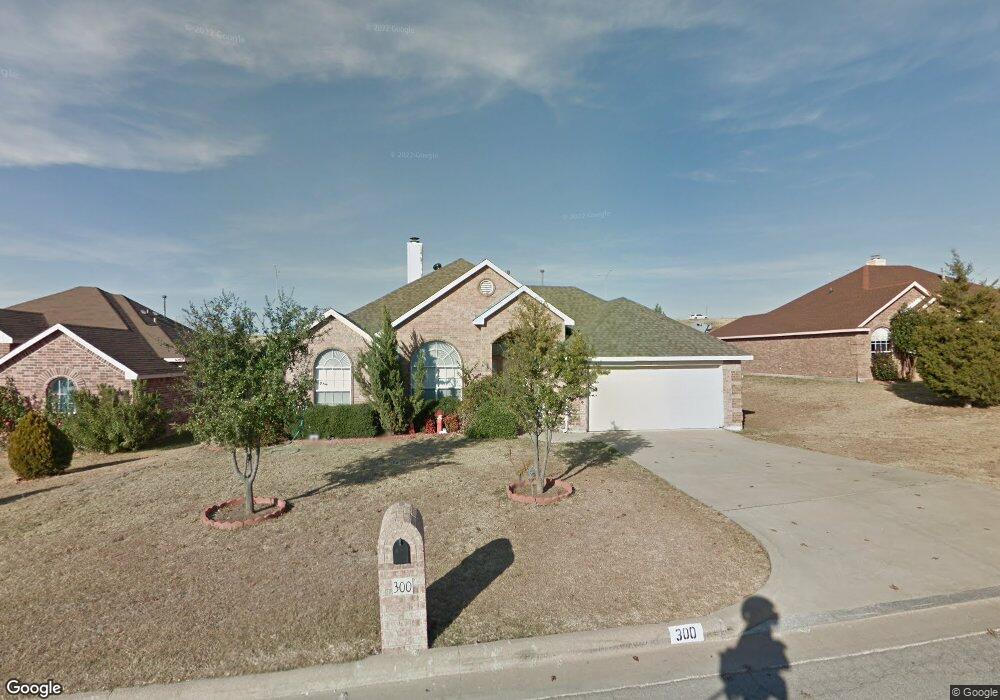
300 Ridge View Ct Decatur, TX 76234
Estimated Value: $307,846 - $371,000
3
Beds
2
Baths
1,747
Sq Ft
$192/Sq Ft
Est. Value
About This Home
This home is located at 300 Ridge View Ct, Decatur, TX 76234 and is currently estimated at $334,712, approximately $191 per square foot. 300 Ridge View Ct is a home located in Wise County with nearby schools including Decatur High School and Victory Christian Academy.
Ownership History
Date
Name
Owned For
Owner Type
Purchase Details
Closed on
Jul 26, 2005
Sold by
Culberson Justin and Culberson Mary Ryan
Bought by
Mares Manuel and Mares Veronica
Current Estimated Value
Home Financials for this Owner
Home Financials are based on the most recent Mortgage that was taken out on this home.
Original Mortgage
$145,500
Outstanding Balance
$76,187
Interest Rate
5.61%
Mortgage Type
New Conventional
Estimated Equity
$258,525
Purchase Details
Closed on
Jul 21, 2003
Sold by
Mesta B
Bought by
Mares Manuel and Mares Veronica
Purchase Details
Closed on
Feb 14, 2002
Sold by
Aaron Baltazar Ltd
Bought by
Mares Manuel and Mares Veronica
Purchase Details
Closed on
Sep 4, 2001
Sold by
Baltazar Aaron Ltd
Bought by
Mares Manuel and Mares Veronica
Purchase Details
Closed on
Nov 14, 2000
Sold by
Fenoglio Tommy L and Horton Elli
Bought by
Mares Manuel and Mares Veronica
Purchase Details
Closed on
Aug 6, 1999
Sold by
Fenoglio Tommy L and May Charles
Bought by
Mares Manuel and Mares Veronica
Create a Home Valuation Report for This Property
The Home Valuation Report is an in-depth analysis detailing your home's value as well as a comparison with similar homes in the area
Home Values in the Area
Average Home Value in this Area
Purchase History
| Date | Buyer | Sale Price | Title Company |
|---|---|---|---|
| Mares Manuel | -- | Texas United Title Inc | |
| Mares Manuel | -- | -- | |
| Mares Manuel | -- | -- | |
| Mares Manuel | -- | -- | |
| Mares Manuel | -- | -- | |
| Mares Manuel | -- | -- |
Source: Public Records
Mortgage History
| Date | Status | Borrower | Loan Amount |
|---|---|---|---|
| Open | Mares Manuel | $145,500 |
Source: Public Records
Tax History Compared to Growth
Tax History
| Year | Tax Paid | Tax Assessment Tax Assessment Total Assessment is a certain percentage of the fair market value that is determined by local assessors to be the total taxable value of land and additions on the property. | Land | Improvement |
|---|---|---|---|---|
| 2025 | $4,585 | $331,080 | $75,264 | $255,816 |
| 2024 | $4,585 | $310,969 | $0 | $0 |
| 2023 | $5,128 | $282,699 | $0 | $0 |
| 2022 | $5,628 | $256,999 | $0 | $0 |
| 2021 | $5,332 | $233,640 | $39,170 | $194,470 |
| 2020 | $5,125 | $218,490 | $36,610 | $181,880 |
| 2019 | $5,267 | $215,000 | $36,610 | $178,390 |
| 2018 | $4,995 | $193,180 | $17,940 | $175,240 |
| 2017 | $4,560 | $179,790 | $17,940 | $161,850 |
| 2016 | $4,145 | $164,610 | $17,940 | $146,670 |
| 2015 | -- | $145,180 | $15,380 | $129,800 |
| 2014 | -- | $138,560 | $15,380 | $123,180 |
Source: Public Records
Map
Nearby Homes
- 304 Cyndilu Ln
- 114 Sondra Lin Blvd
- 903 N Miller St
- 307 E Vernon St
- 606 W Mulberry St
- 802 N Church St
- 700 N Church St
- 407 N Lane St
- 602 N Cates St
- 4112 U S 380
- 50+/- acres U S 380
- 1404 Shady Ln
- 2811 N Trinity St
- 1 S Martin Extension
- 1408 N Business 287
- TBD Farm To Market 51
- 0 N Hwy 287 Unit 25379920
- 305 E Shoemaker St
- 401 S Holman St
- 506 E Main St
- 302 Ridge View Ct
- 208 Ridge View Ct
- 304 Ridge View Ct
- 301 Ridge View Ct
- 209 Ridge View Ct
- 306 Ridge View Ct
- 305 Ridge View Ct
- 207 Ridge View Ct
- 308 Ridge View Ct
- 205 Ridge View Ct
- 202 Ridge View Ct
- 230 Greathouse Village
- 240 Greathouse Village
- 220 Greathouse Village
- 250 Greathouse Village
- 210 Greathouse Village
- 200 Greathouse Village
- 310 Ridge View Ct
- 270 Greathouse Village
- 180 Greathouse Village