Estimated Value: $544,850 - $614,000
--
Bed
--
Bath
2,475
Sq Ft
$229/Sq Ft
Est. Value
About This Home
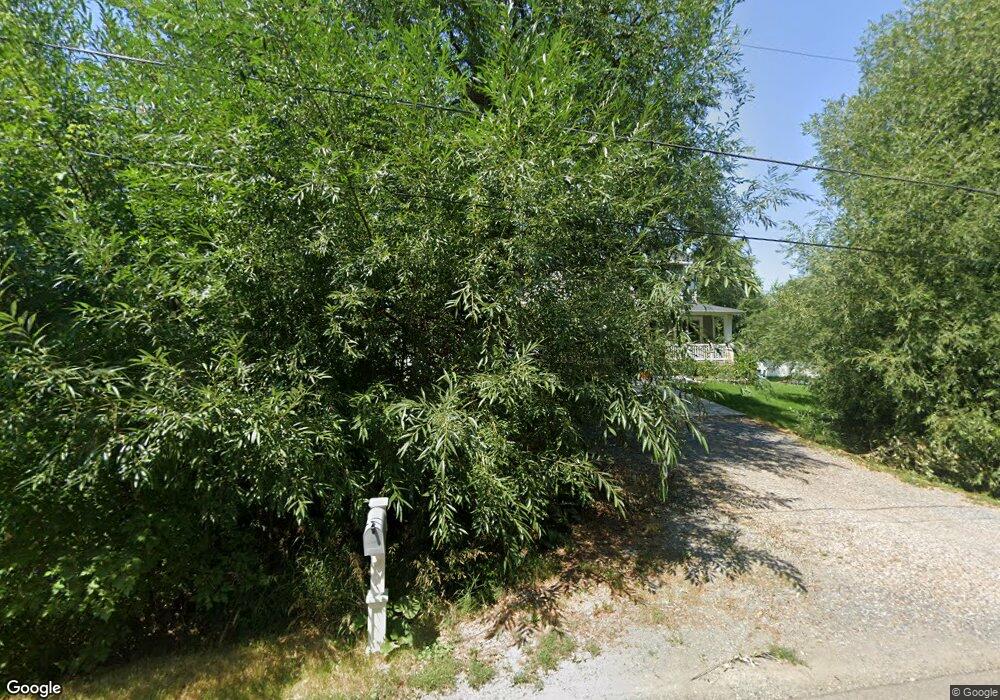
This home is located at 300 S 300 E, Hyrum, UT 84319 and is currently estimated at $567,213, approximately $229 per square foot. 300 S 300 E is a home located in Cache County with nearby schools including Lincoln School, South Cache Middle School, and Mountain Crest High School.
Ownership History
Date
Name
Owned For
Owner Type
Purchase Details
Closed on
Dec 14, 2020
Sold by
Perkins Todd C and Perkins Kimberly A
Bought by
Perkins Todd Clark and Perkins Kimberly Ann
Current Estimated Value
Home Financials for this Owner
Home Financials are based on the most recent Mortgage that was taken out on this home.
Original Mortgage
$276,000
Outstanding Balance
$245,156
Interest Rate
2.7%
Mortgage Type
New Conventional
Estimated Equity
$322,057
Purchase Details
Closed on
Sep 29, 2017
Sold by
Perkins Dennis D
Bought by
Perkins Todd C and Perkins Kimberly A
Home Financials for this Owner
Home Financials are based on the most recent Mortgage that was taken out on this home.
Original Mortgage
$253,600
Interest Rate
3.89%
Mortgage Type
New Conventional
Purchase Details
Closed on
May 16, 2017
Sold by
Perkins Todd C and Perkins Kimberly A
Bought by
Perkins Todd C and Perkins Kimberly A
Home Financials for this Owner
Home Financials are based on the most recent Mortgage that was taken out on this home.
Original Mortgage
$250,120
Interest Rate
3.97%
Mortgage Type
Commercial
Purchase Details
Closed on
Apr 5, 2017
Sold by
Rasmussen Paul B and Rasmussen Bruce
Bought by
Perkins Todd C and Perkins Kimberly A
Home Financials for this Owner
Home Financials are based on the most recent Mortgage that was taken out on this home.
Original Mortgage
$250,120
Interest Rate
3.97%
Mortgage Type
Commercial
Create a Home Valuation Report for This Property
The Home Valuation Report is an in-depth analysis detailing your home's value as well as a comparison with similar homes in the area
Home Values in the Area
Average Home Value in this Area
Purchase History
| Date | Buyer | Sale Price | Title Company |
|---|---|---|---|
| Perkins Todd Clark | -- | Pinnacle Title | |
| Perkins Todd C | -- | -- | |
| Perkins Todd C | -- | American Secure Title | |
| Perkins Todd C | -- | American Secure Title |
Source: Public Records
Mortgage History
| Date | Status | Borrower | Loan Amount |
|---|---|---|---|
| Open | Perkins Todd Clark | $276,000 | |
| Closed | Perkins Todd C | $253,600 | |
| Closed | Perkins Todd C | $250,120 |
Source: Public Records
Tax History Compared to Growth
Tax History
| Year | Tax Paid | Tax Assessment Tax Assessment Total Assessment is a certain percentage of the fair market value that is determined by local assessors to be the total taxable value of land and additions on the property. | Land | Improvement |
|---|---|---|---|---|
| 2025 | $207 | $297,530 | $0 | $0 |
| 2024 | $2,207 | $295,965 | $0 | $0 |
| 2023 | $2,617 | $335,475 | $0 | $0 |
| 2022 | $2,731 | $335,475 | $0 | $0 |
| 2021 | $2,176 | $411,908 | $65,050 | $346,858 |
| 2020 | $2,064 | $366,666 | $65,050 | $301,616 |
| 2019 | $2,033 | $339,616 | $38,000 | $301,616 |
| 2018 | $1,903 | $307,300 | $38,000 | $269,300 |
| 2017 | $453 | $38,000 | $0 | $0 |
| 2016 | $464 | $38,000 | $0 | $0 |
| 2015 | $465 | $38,000 | $0 | $0 |
| 2014 | $452 | $37,800 | $0 | $0 |
| 2013 | $419 | $37,800 | $0 | $0 |
Source: Public Records
Map
Nearby Homes