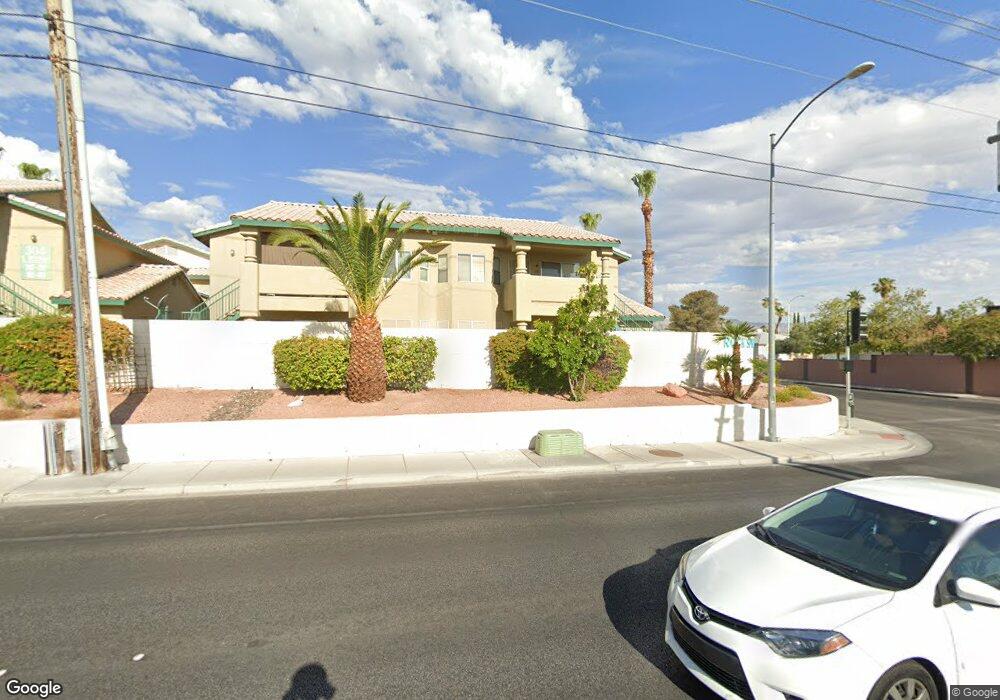
300 S Buffalo Dr Unit 101 Las Vegas, NV 89145
Angel Park NeighborhoodEstimated Value: $215,000 - $232,000
2
Beds
2
Baths
996
Sq Ft
$224/Sq Ft
Est. Value
About This Home
This home is located at 300 S Buffalo Dr Unit 101, Las Vegas, NV 89145 and is currently estimated at $223,493, approximately $224 per square foot. 300 S Buffalo Dr Unit 101 is a home located in Clark County with nearby schools including Helen M Smith Elementary School, Walter Johnson Junior High School Academy of International Studies, and Bonanza High School.
Ownership History
Date
Name
Owned For
Owner Type
Purchase Details
Closed on
Jun 17, 2010
Sold by
Aurora Loan Services Llc
Bought by
Reyes Simon Q and Daquioag Estrella T
Current Estimated Value
Purchase Details
Closed on
Apr 1, 2010
Sold by
Roudenko Anna
Bought by
Aurora Loan Services Llc
Purchase Details
Closed on
Aug 17, 2004
Sold by
Mahoney Donna
Bought by
Roudenko Anna
Home Financials for this Owner
Home Financials are based on the most recent Mortgage that was taken out on this home.
Original Mortgage
$151,805
Interest Rate
5.95%
Mortgage Type
FHA
Purchase Details
Closed on
Dec 15, 1994
Sold by
Jrm Development Inc
Bought by
Mahoney Donna
Home Financials for this Owner
Home Financials are based on the most recent Mortgage that was taken out on this home.
Original Mortgage
$67,400
Interest Rate
9.25%
Create a Home Valuation Report for This Property
The Home Valuation Report is an in-depth analysis detailing your home's value as well as a comparison with similar homes in the area
Home Values in the Area
Average Home Value in this Area
Purchase History
| Date | Buyer | Sale Price | Title Company |
|---|---|---|---|
| Reyes Simon Q | $43,000 | Fidelity Rainbow | |
| Aurora Loan Services Llc | $155,944 | Servicelink | |
| Roudenko Anna | $156,500 | Nevada Title Company | |
| Mahoney Donna | $71,000 | Land Title |
Source: Public Records
Mortgage History
| Date | Status | Borrower | Loan Amount |
|---|---|---|---|
| Previous Owner | Roudenko Anna | $151,805 | |
| Previous Owner | Mahoney Donna | $67,400 |
Source: Public Records
Tax History Compared to Growth
Tax History
| Year | Tax Paid | Tax Assessment Tax Assessment Total Assessment is a certain percentage of the fair market value that is determined by local assessors to be the total taxable value of land and additions on the property. | Land | Improvement |
|---|---|---|---|---|
| 2025 | $878 | $45,033 | $19,600 | $25,433 |
| 2024 | $674 | $45,033 | $19,600 | $25,433 |
| 2023 | $674 | $48,774 | $25,200 | $23,574 |
| 2022 | $625 | $39,352 | $17,500 | $21,852 |
| 2021 | $579 | $37,213 | $15,925 | $21,288 |
| 2020 | $534 | $37,728 | $16,450 | $21,278 |
| 2019 | $501 | $33,758 | $12,600 | $21,158 |
| 2018 | $478 | $28,729 | $8,050 | $20,679 |
| 2017 | $890 | $27,157 | $5,950 | $21,207 |
| 2016 | $449 | $22,179 | $4,200 | $17,979 |
| 2015 | $447 | $17,906 | $4,200 | $13,706 |
| 2014 | $434 | $13,334 | $4,200 | $9,134 |
Source: Public Records
Map
Nearby Homes
- 7601 Ducharme Ave Unit 201
- 304 S Buffalo Dr Unit 201
- 328 S Buffalo Dr Unit 101
- 338 Jett St Unit 101
- 212 Bradshaw Way
- 7716 Ducharme Ave
- 332 Huntly Rd Unit 13C
- 425 Cherry Meadows Ct
- 7220 Stormson Dr
- 7700 Tomich Ave
- 120 Firestone Dr
- 7121 Hurricane Way
- 7200 Alta Dr
- 101 Luna Way Unit 267
- 101 Luna Way Unit 145
- 101 Luna Way Unit 253
- 129 Farkas Ln
- 7873 Mount Whitney Cir
- 7212 Raincloud Dr
- 317 Coconut Grove Ct Unit 3
- 332 S Buffalo Dr Unit 101
- 304 S Buffalo Dr Unit 202
- 324 S Buffalo Dr Unit 201
- 336 S Buffalo Dr Unit 101
- 332 S Buffalo Dr Unit 201
- 336 S Buffalo Dr Unit 102
- 332 S Buffalo Dr Unit 202
- 300 S Buffalo Dr Unit 202
- 328 S Buffalo Dr Unit 102
- 300 S Buffalo Dr Unit 102
- 304 S Buffalo Dr Unit 102
- 336 S Buffalo Dr Unit 201
- 324 S Buffalo Dr Unit 202
- 324 S Buffalo Dr Unit 102
- 336 S Buffalo Dr Unit 202
- 304 S Buffalo Dr Unit 101
- 324 S Buffalo Dr Unit 101
- 300 S Buffalo Dr Unit 201
- 328 S Buffalo Dr Unit 201
- 332 S Buffalo Dr Unit 102