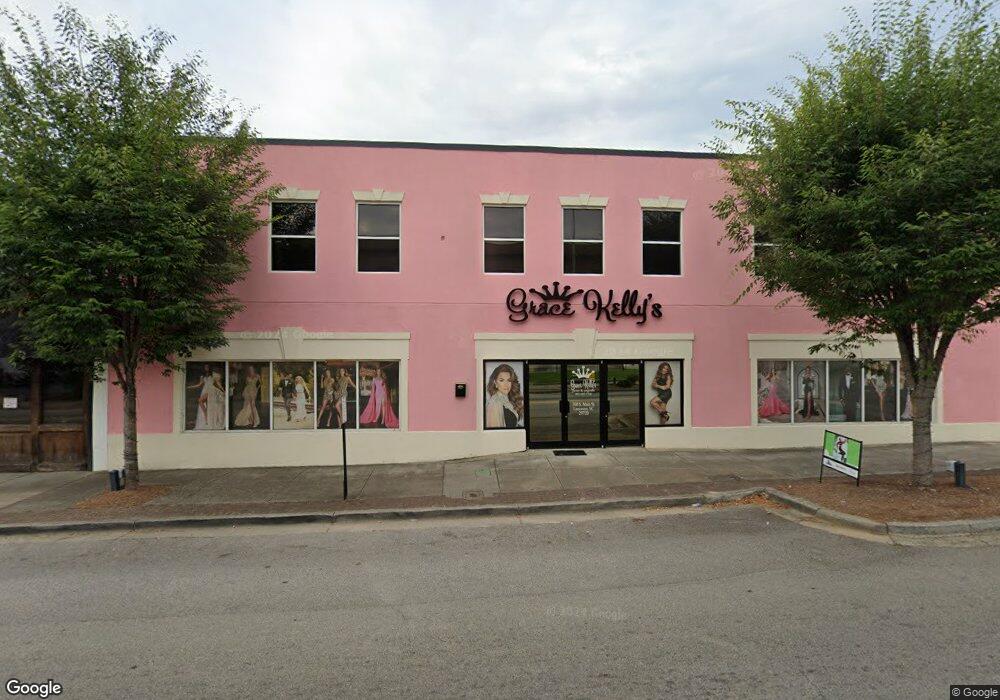
300 S Main St Lancaster, SC 29720
Estimated Value: $443,453
About This Home
This home is located at 300 S Main St, Lancaster, SC 29720 and is currently estimated at $443,453, approximately $37 per square foot. 300 S Main St is a home located in Lancaster County with nearby schools including Brooklyn Springs Elementary School, Buford Middle School, and Lancaster High School.
Ownership History
We collect this data history from publicly available records. To have your information removed, we recommend requesting removal directly through your county’s website.
Purchase Details
Home Financials for this Owner
Home Financials are based on the most recent Mortgage that was taken out on this home.Purchase Details
Home Values in the Area
Average Home Value in this Area
Purchase History
We collect this data history from publicly available records. To have your information removed, we recommend requesting removal directly through your county’s website.
| Date | Buyer | Sale Price | Title Company |
|---|---|---|---|
| $400,000 | None Listed On Document | ||
| $100,000 | -- |
Mortgage History
We collect this data history from publicly available records. To have your information removed, we recommend requesting removal directly through your county’s website.
| Date | Status | Borrower | Loan Amount |
|---|---|---|---|
| Closed | $360,000 |
Tax History
We collect this data history from publicly available records. To have your information removed, we recommend requesting removal directly through your county’s website.
| Year | Tax Paid | Tax Assessment Tax Assessment Total Assessment is a certain percentage of the fair market value that is determined by local assessors to be the total taxable value of land and additions on the property. | Land | Improvement |
|---|---|---|---|---|
| 2025 | $10,190 | $23,760 | $2,484 | $21,276 |
| 2024 | $10,447 | $23,880 | $2,484 | $21,396 |
| 2023 | $10,963 | $23,880 | $2,484 | $21,396 |
| 2022 | $4,206 | $9,420 | $2,160 | $7,260 |
| 2021 | $4,150 | $9,420 | $2,160 | $7,260 |
| 2020 | $3,927 | $9,000 | $2,160 | $6,840 |
| 2019 | $4,599 | $9,000 | $2,160 | $6,840 |
| 2018 | $2,929 | $9,000 | $2,160 | $6,840 |
| 2017 | $3,680 | $0 | $0 | $0 |
| 2016 | $3,700 | $0 | $0 | $0 |
| 2015 | $5,935 | $0 | $0 | $0 |
| 2014 | $5,935 | $0 | $0 | $0 |
| 2013 | $5,935 | $0 | $0 | $0 |
Map
- 307 E Arch St
- 302 W Gay St
- 2019 Moorside Ct
- 304 W Gay St
- 306 E Arch St
- 106 N Market St
- 105 S York St
- 105 N Market St
- 507 W Arch St
- 504 W Arch St
- 514 W Arch St
- 332 E Dunlap St
- 209 Rickenbacker St
- 128 Pleasant Hill St
- 303 N White St
- 305 N White St
- 119 Barron Blvd
- 117 Barron Blvd
- 468 Elm St
- 111 Magnolia Ln
Ask me questions while you tour the home.