Studio
--
Bath
4,010
Sq Ft
0.34
Acres
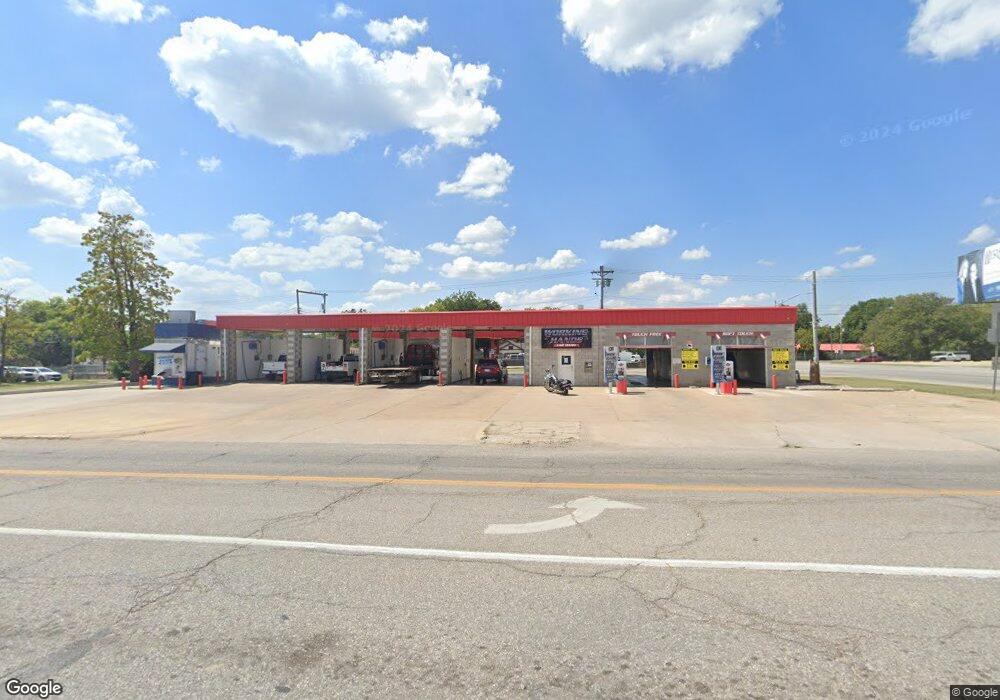
About This Home
This home is located at 300 S Main St, Miami, OK 74354. 300 S Main St is a home located in Ottawa County with nearby schools including Miami High School and Mt. Olive Lutheran School.
Ownership History
Date
Name
Owned For
Owner Type
Purchase Details
Closed on
Jun 24, 2022
Sold by
Reisch Travis S and Reisch Laurie A
Bought by
Working Hands Car Wash Llc
Home Financials for this Owner
Home Financials are based on the most recent Mortgage that was taken out on this home.
Original Mortgage
$992,000
Outstanding Balance
$942,482
Interest Rate
5.1%
Mortgage Type
Credit Line Revolving
Purchase Details
Closed on
Jan 1, 2012
Sold by
Dye Michael E and Dye Connie S
Bought by
Nowata Re Con Investments Llc
Purchase Details
Closed on
Feb 20, 2001
Bought by
Dye Michael and Dye Connie
Purchase Details
Closed on
Aug 23, 1996
Bought by
Maple Street Properties
Create a Home Valuation Report for This Property
The Home Valuation Report is an in-depth analysis detailing your home's value as well as a comparison with similar homes in the area
Purchase History
| Date | Buyer | Sale Price | Title Company |
|---|---|---|---|
| Working Hands Car Wash Llc | -- | None Listed On Document | |
| Nowata Re Con Investments Llc | -- | None Available | |
| Dye Michael | $1,000 | -- | |
| Maple Street Properties | $105,000 | -- |
Source: Public Records
Mortgage History
| Date | Status | Borrower | Loan Amount |
|---|---|---|---|
| Open | Working Hands Car Wash Llc | $992,000 |
Source: Public Records
Tax History
| Year | Tax Paid | Tax Assessment Tax Assessment Total Assessment is a certain percentage of the fair market value that is determined by local assessors to be the total taxable value of land and additions on the property. | Land | Improvement |
|---|---|---|---|---|
| 2025 | $2,878 | $29,861 | $11,400 | $18,461 |
| 2024 | $3,114 | $32,307 | $11,400 | $20,907 |
| 2023 | $3,114 | $33,060 | $11,400 | $21,660 |
| 2022 | $3,056 | $33,060 | $11,400 | $21,660 |
| 2021 | $3,103 | $32,831 | $11,171 | $21,660 |
| 2020 | $3,129 | $32,832 | $9,142 | $23,690 |
| 2019 | $2,682 | $32,660 | $4,468 | $28,192 |
| 2018 | $2,699 | $32,660 | $4,468 | $28,192 |
| 2017 | $2,744 | $32,660 | $4,468 | $28,192 |
| 2016 | $2,688 | $33,463 | $4,468 | $28,995 |
| 2015 | $2,568 | $28,906 | $4,255 | $24,651 |
| 2014 | $2,741 | $33,463 | $4,468 | $28,995 |
Source: Public Records
Map
Nearby Homes
Your Personal Tour Guide
Ask me questions while you tour the home.