--
Bed
--
Bath
504
Sq Ft
0.28
Acres
About This Home
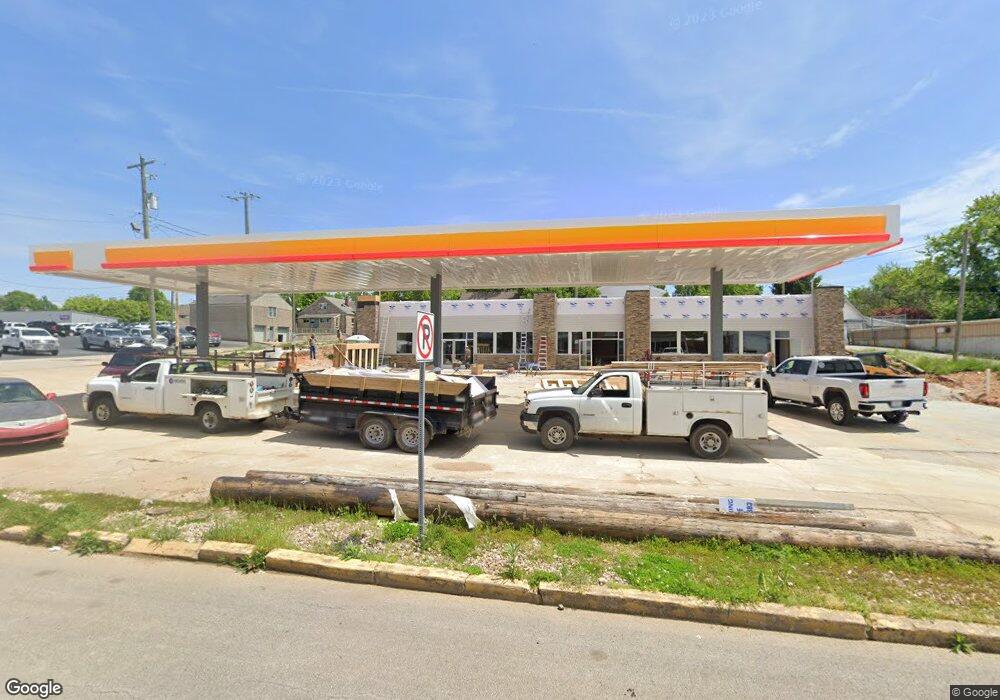
This home is located at 300 S Main St, Salem, IN 47167. 300 S Main St is a home located in Washington County with nearby schools including Bradie M. Shrum Lower Elementary School, Salem Middle School, and Salem High School.
Ownership History
Date
Name
Owned For
Owner Type
Purchase Details
Closed on
Feb 9, 2023
Sold by
Nishikrisha Llc
Bought by
Nk Salem Property Llc
Home Financials for this Owner
Home Financials are based on the most recent Mortgage that was taken out on this home.
Original Mortgage
$2,200,000
Outstanding Balance
$1,969,228
Interest Rate
6.33%
Mortgage Type
New Conventional
Purchase Details
Closed on
Sep 20, 2018
Sold by
Nishikrisha Llc
Bought by
Nishikrisha Llc
Purchase Details
Closed on
Apr 18, 2018
Sold by
Benson Frank B
Bought by
Kalpana Patel
Purchase Details
Closed on
Feb 27, 2017
Sold by
Richardson Rick L and Richardson Elizebth S
Bought by
Mid Southern Savings Bank
Create a Home Valuation Report for This Property
The Home Valuation Report is an in-depth analysis detailing your home's value as well as a comparison with similar homes in the area
Home Values in the Area
Average Home Value in this Area
Purchase History
| Date | Buyer | Sale Price | Title Company |
|---|---|---|---|
| Nk Salem Property Llc | -- | -- | |
| Nishikrisha Llc | -- | None Available | |
| Kalpana Patel | $30,000 | -- | |
| Mid Southern Savings Bank | $60,000 | None Available |
Source: Public Records
Mortgage History
| Date | Status | Borrower | Loan Amount |
|---|---|---|---|
| Open | Nk Salem Property Llc | $2,200,000 |
Source: Public Records
Tax History Compared to Growth
Tax History
| Year | Tax Paid | Tax Assessment Tax Assessment Total Assessment is a certain percentage of the fair market value that is determined by local assessors to be the total taxable value of land and additions on the property. | Land | Improvement |
|---|---|---|---|---|
| 2024 | $4,296 | $143,200 | $76,600 | $66,600 |
| 2023 | $2,991 | $99,700 | $76,600 | $23,100 |
| 2022 | $2,997 | $99,900 | $76,600 | $23,300 |
| 2021 | $2,955 | $98,500 | $76,600 | $21,900 |
| 2020 | $2,982 | $99,400 | $76,600 | $22,800 |
| 2019 | $2,982 | $99,400 | $76,600 | $22,800 |
| 2018 | $2,973 | $99,100 | $76,600 | $22,500 |
| 2017 | $2,961 | $98,700 | $76,600 | $22,100 |
| 2016 | $2,952 | $98,400 | $76,600 | $21,800 |
| 2014 | $2,973 | $99,100 | $76,600 | $22,500 |
| 2013 | $2,979 | $99,300 | $76,600 | $22,700 |
Source: Public Records
Map
Nearby Homes
- 52 Public Square
- (Tract 2) 5484 State Road 135
- 301 E Market St
- 303 W Market St
- 701 S Main St
- 205 S Harrison St
- 412 Ridgeview Dr
- 805 Smith St
- 404 E Mulberry St
- 0 S Side South Boston Pekin Rd
- 406 W Mulberry St
- 104 Hounds Way
- 101, 103, & 105 Hounds Way
- 115 Nichols Ave
- 801 N College Ave
- 800 Hayes Ave
- 0 W Mulberry St
- 102 Mahuron Dr
- 808 Locust St
- 1000 W Market St