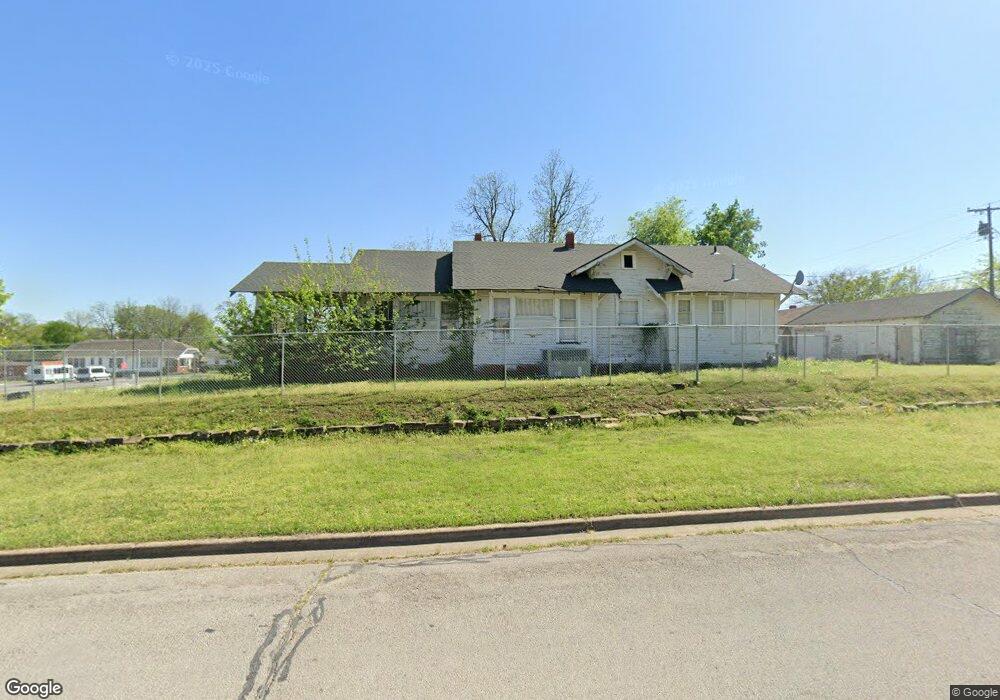
300 S Park St Sapulpa, OK 74066
Estimated Value: $171,000 - $242,000
3
Beds
1
Bath
1,727
Sq Ft
$115/Sq Ft
Est. Value
About This Home
This home is located at 300 S Park St, Sapulpa, OK 74066 and is currently estimated at $198,337, approximately $114 per square foot. 300 S Park St is a home located in Creek County with nearby schools including Sapulpa Junior High School, Sapulpa Middle School, and Sapulpa High School.
Ownership History
Date
Name
Owned For
Owner Type
Purchase Details
Closed on
Jul 21, 2012
Sold by
Bennett Catherine I
Bought by
Bennett Catherine L
Current Estimated Value
Home Financials for this Owner
Home Financials are based on the most recent Mortgage that was taken out on this home.
Original Mortgage
$112,525
Outstanding Balance
$77,580
Interest Rate
3.72%
Mortgage Type
New Conventional
Estimated Equity
$120,757
Purchase Details
Closed on
Jul 19, 2012
Sold by
Bennett James William
Bought by
Benett Catherine Irene
Home Financials for this Owner
Home Financials are based on the most recent Mortgage that was taken out on this home.
Original Mortgage
$112,525
Outstanding Balance
$77,580
Interest Rate
3.72%
Mortgage Type
New Conventional
Estimated Equity
$120,757
Purchase Details
Closed on
Jan 10, 2008
Sold by
Bridgewater Greg and Bridgewater Rhonda
Bought by
Bennett Catherine I
Home Financials for this Owner
Home Financials are based on the most recent Mortgage that was taken out on this home.
Original Mortgage
$99,000
Interest Rate
5.94%
Mortgage Type
New Conventional
Create a Home Valuation Report for This Property
The Home Valuation Report is an in-depth analysis detailing your home's value as well as a comparison with similar homes in the area
Home Values in the Area
Average Home Value in this Area
Purchase History
| Date | Buyer | Sale Price | Title Company |
|---|---|---|---|
| Bennett Catherine L | -- | None Available | |
| Benett Catherine Irene | -- | None Available | |
| Bennett Catherine I | $99,000 | None Available |
Source: Public Records
Mortgage History
| Date | Status | Borrower | Loan Amount |
|---|---|---|---|
| Open | Bennett Catherine L | $112,525 | |
| Previous Owner | Bennett Catherine I | $99,000 |
Source: Public Records
Tax History Compared to Growth
Tax History
| Year | Tax Paid | Tax Assessment Tax Assessment Total Assessment is a certain percentage of the fair market value that is determined by local assessors to be the total taxable value of land and additions on the property. | Land | Improvement |
|---|---|---|---|---|
| 2025 | $1,492 | $13,421 | $1,740 | $11,681 |
| 2024 | $1,492 | $13,273 | $1,740 | $11,533 |
| 2023 | $1,492 | $12,887 | $1,740 | $11,147 |
| 2022 | $1,322 | $12,512 | $1,740 | $10,772 |
| 2021 | $1,485 | $13,521 | $1,740 | $11,781 |
| 2020 | $1,431 | $13,127 | $1,740 | $11,387 |
| 2019 | $1,392 | $12,745 | $1,740 | $11,005 |
| 2018 | $1,376 | $12,374 | $1,740 | $10,634 |
| 2017 | $1,369 | $12,374 | $1,740 | $10,634 |
| 2016 | $1,302 | $12,374 | $1,740 | $10,634 |
| 2015 | -- | $12,237 | $1,653 | $10,584 |
| 2014 | -- | $11,880 | $1,426 | $10,454 |
Source: Public Records
Map
Nearby Homes
- 210 S Water St
- 507 S Park St
- 320 E Mckinley Ave
- 317 S Poplar St
- 111 S Poplar St
- 314 S Poplar St
- 410 S Poplar St
- 612 S Park St
- 207 S Walnut St
- 609 S Poplar St
- 206 S Mounds St
- 303 W Mckinley Ave
- 14 S Mounds St
- 702 S Main St
- 310 W Lee Ave
- 511 S Maple St
- 139 S Hickory St
- 131 S Hickory St
- 637 S Mounds St
- 321 W Bryan Ave