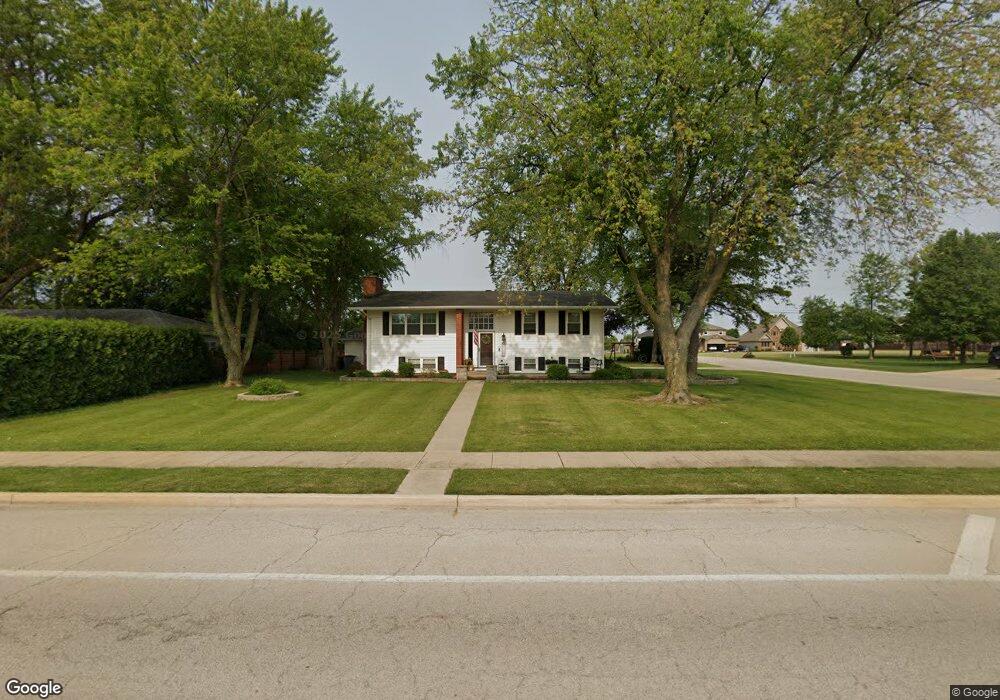
300 S Rathje Rd Peotone, IL 60468
Estimated Value: $284,000 - $407,000
--
Bed
--
Bath
--
Sq Ft
0.42
Acres
About This Home
This home is located at 300 S Rathje Rd, Peotone, IL 60468 and is currently estimated at $346,224. 300 S Rathje Rd is a home located in Will County with nearby schools including Peotone Elementary School, Peotone Intermediate Center, and Peotone Junior High School.
Ownership History
Date
Name
Owned For
Owner Type
Purchase Details
Closed on
Dec 27, 2024
Sold by
Bias Rhonni and Bias Rhonni R
Bought by
Bias Rhonni R and Callaway Sandra
Current Estimated Value
Home Financials for this Owner
Home Financials are based on the most recent Mortgage that was taken out on this home.
Original Mortgage
$218,000
Outstanding Balance
$216,433
Interest Rate
6.63%
Mortgage Type
New Conventional
Estimated Equity
$129,791
Purchase Details
Closed on
Aug 9, 2022
Sold by
Bias David M and Bias Rhonni
Bought by
Bias Rhonni
Purchase Details
Closed on
Apr 17, 2007
Sold by
Westfall Dolores E
Bought by
Bias David M and Bias Rhonni R
Home Financials for this Owner
Home Financials are based on the most recent Mortgage that was taken out on this home.
Original Mortgage
$251,750
Interest Rate
6.2%
Mortgage Type
Purchase Money Mortgage
Create a Home Valuation Report for This Property
The Home Valuation Report is an in-depth analysis detailing your home's value as well as a comparison with similar homes in the area
Home Values in the Area
Average Home Value in this Area
Purchase History
| Date | Buyer | Sale Price | Title Company |
|---|---|---|---|
| Bias Rhonni R | -- | Title365 | |
| Bias Rhonni | -- | Chaplinski Claire | |
| Bias David M | $265,000 | None Available |
Source: Public Records
Mortgage History
| Date | Status | Borrower | Loan Amount |
|---|---|---|---|
| Open | Bias Rhonni R | $218,000 | |
| Previous Owner | Bias David M | $251,750 |
Source: Public Records
Tax History Compared to Growth
Tax History
| Year | Tax Paid | Tax Assessment Tax Assessment Total Assessment is a certain percentage of the fair market value that is determined by local assessors to be the total taxable value of land and additions on the property. | Land | Improvement |
|---|---|---|---|---|
| 2024 | $5,597 | $99,400 | $23,148 | $76,252 |
| 2023 | $5,597 | $95,634 | $18,161 | $77,473 |
| 2022 | $5,352 | $86,273 | $16,383 | $69,890 |
| 2021 | $5,114 | $79,727 | $15,140 | $64,587 |
| 2020 | $4,965 | $75,714 | $14,378 | $61,336 |
| 2019 | $5,185 | $75,714 | $14,378 | $61,336 |
| 2018 | $5,542 | $75,714 | $14,378 | $61,336 |
| 2017 | $5,350 | $72,850 | $13,127 | $59,723 |
| 2016 | $5,272 | $71,422 | $12,870 | $58,552 |
| 2015 | $5,449 | $69,074 | $12,447 | $56,627 |
| 2014 | $5,449 | $69,074 | $12,447 | $56,627 |
| 2013 | $5,449 | $69,568 | $12,536 | $57,032 |
Source: Public Records
Map
Nearby Homes
- The Sommerville Plan at Westgate Manor
- The FoxGrove Plan at Westgate Manor
- The Prairie View Plan at Westgate Manor
- The Aspen II Plan at Westgate Manor
- The Manchester II Plan at Westgate Manor
- The Prairie II Plan at Westgate Manor
- The Stonebridge II Plan at Westgate Manor
- Lot 015 S Rathje Rd
- 405 Locust Ln
- 927 Locust Ln
- 0 W Wilmington Rd
- 1035 Bonnie Ln
- Sec.32 W T 33n R 13e Rd
- 332 W North St
- 00 S Center Rd
- 0 W Wilmington Rd
- 200 W Crawford St
- 205 W Crawford St
- 404 E South St
- 321 E Main St
- Lot 49 Garfield Ave
- Lot 58 Garfield Ave
- Lot 51 Garfield Ave
- Lot 60 Garfield Ave
- 312 S Rathje Rd
- 246 S Rathje Rd
- 415 S Westgate Dr
- 419 Jean St
- 315 Westgate Dr
- 303 S Rathje Rd
- 309 S Rathje Rd
- 423 S Jean St
- 321 S Rathje Rd
- 400 S Rathje Rd
- 311 Westgate Dr
- 232 S Rathje Rd
- 243 S Rathje Rd
- 237 S Rathje Rd
- 414 S Westgate Dr
- 312 Westgate Dr