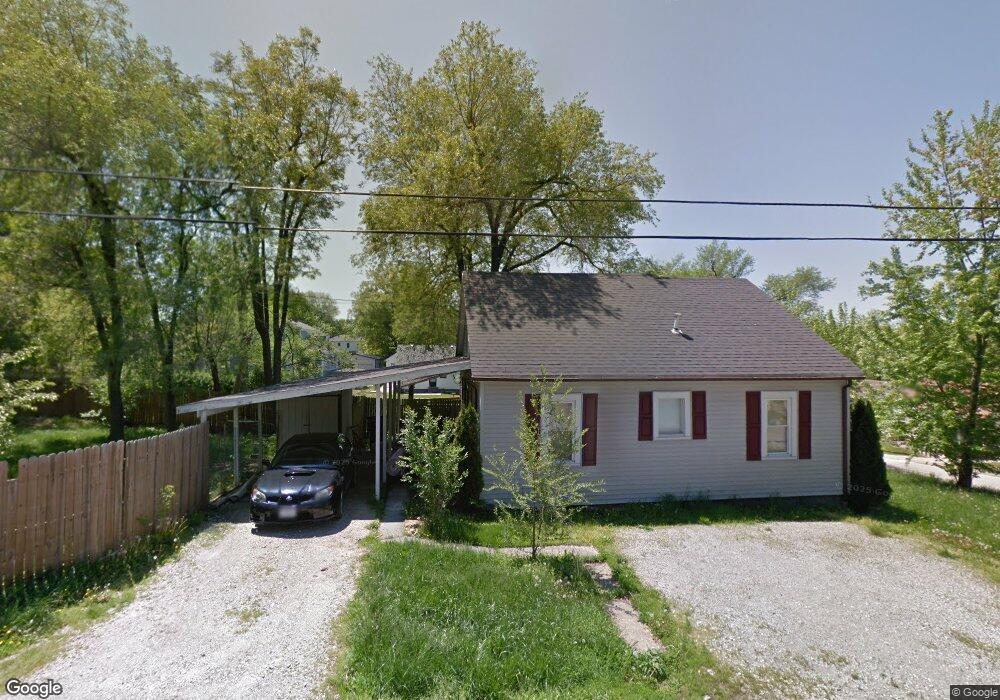
300 Saint Francis St Fulton, MO 65251
Estimated Value: $141,000 - $167,000
2
Beds
1
Bath
1,010
Sq Ft
$152/Sq Ft
Est. Value
About This Home
This home is located at 300 Saint Francis St, Fulton, MO 65251 and is currently estimated at $153,849, approximately $152 per square foot. 300 Saint Francis St is a home located in Callaway County with nearby schools including Fulton Senior High School, Kingdom Christian Academy, and St. Peter Catholic School.
Ownership History
Date
Name
Owned For
Owner Type
Purchase Details
Closed on
Jun 14, 2024
Sold by
Lander Properties Llc
Bought by
Ebersole Derek and Ebersole Ashley
Current Estimated Value
Home Financials for this Owner
Home Financials are based on the most recent Mortgage that was taken out on this home.
Original Mortgage
$260,000
Outstanding Balance
$257,517
Interest Rate
8.5%
Mortgage Type
Credit Line Revolving
Estimated Equity
-$103,668
Purchase Details
Closed on
Jun 24, 2019
Sold by
Haper Valarie
Bought by
Lander Properties Llc
Home Financials for this Owner
Home Financials are based on the most recent Mortgage that was taken out on this home.
Original Mortgage
$42,000
Interest Rate
4%
Mortgage Type
New Conventional
Purchase Details
Closed on
Aug 30, 2005
Sold by
Kyger Kreis and Kyger Kevin
Bought by
Hosenfelt Andrew Joseph and Hosenfelt Valerie
Home Financials for this Owner
Home Financials are based on the most recent Mortgage that was taken out on this home.
Original Mortgage
$46,700
Interest Rate
5.61%
Mortgage Type
New Conventional
Create a Home Valuation Report for This Property
The Home Valuation Report is an in-depth analysis detailing your home's value as well as a comparison with similar homes in the area
Home Values in the Area
Average Home Value in this Area
Purchase History
| Date | Buyer | Sale Price | Title Company |
|---|---|---|---|
| Ebersole Derek | -- | None Listed On Document | |
| Lander Properties Llc | -- | -- | |
| Hosenfelt Andrew Joseph | -- | -- |
Source: Public Records
Mortgage History
| Date | Status | Borrower | Loan Amount |
|---|---|---|---|
| Open | Ebersole Derek | $260,000 | |
| Previous Owner | Lander Properties Llc | $42,000 | |
| Previous Owner | Hosenfelt Andrew Joseph | $46,700 |
Source: Public Records
Tax History Compared to Growth
Tax History
| Year | Tax Paid | Tax Assessment Tax Assessment Total Assessment is a certain percentage of the fair market value that is determined by local assessors to be the total taxable value of land and additions on the property. | Land | Improvement |
|---|---|---|---|---|
| 2024 | $941 | $15,217 | $0 | $0 |
| 2023 | $941 | $14,742 | $0 | $0 |
| 2022 | $907 | $14,742 | $1,140 | $13,602 |
| 2021 | $906 | $14,742 | $1,140 | $13,602 |
| 2020 | $919 | $14,742 | $1,140 | $13,602 |
| 2019 | $889 | $14,742 | $1,140 | $13,602 |
| 2018 | $920 | $14,742 | $1,140 | $13,602 |
| 2017 | $933 | $16,823 | $1,140 | $15,683 |
| 2016 | $500 | $8,640 | $0 | $0 |
| 2015 | $489 | $8,640 | $0 | $0 |
| 2014 | -- | $9,820 | $0 | $0 |
Source: Public Records
Map
Nearby Homes
- 509 S Business 54
- 0 Callaway Dr
- 106 Schultze St
- 308 E 6th St
- 801 Court St
- 703 Bluff St
- 710 Hollyhock Dr
- 528 Kinleigh Dr
- 314 W 9th St
- 1311 Cote Sans Dessein Rd
- 3.69 ACRES Tennyson Rd
- 2946 Missouri F
- TBD Route O
- 0
- 0 Greenwood Hills Lot#18
- 1400 Marbrooke Dr
- 303 E 9th St
- 250 Tennyson Rd
- 506 E 10th St
- 1102 Vine St
- 302 Saint Francis St
- 303 Saint Francis St
- 232 Saint Francis St
- 213 W Oliver St
- 211 W Oliver St
- 212 Tyler St
- 301 Saint Francis St
- 305 Saint Francis St
- 209 W Oliver St
- 208 Tyler St
- 230 Saint Francis St
- 233 Saint Francis St
- 307 Saint Francis St
- 213 Tyler St
- 206 Tyler St
- 207 W Oliver St
- 0 Tyler St
- 309 Saint Francis St
- 211 Tyler St
- 231 Saint Francis St