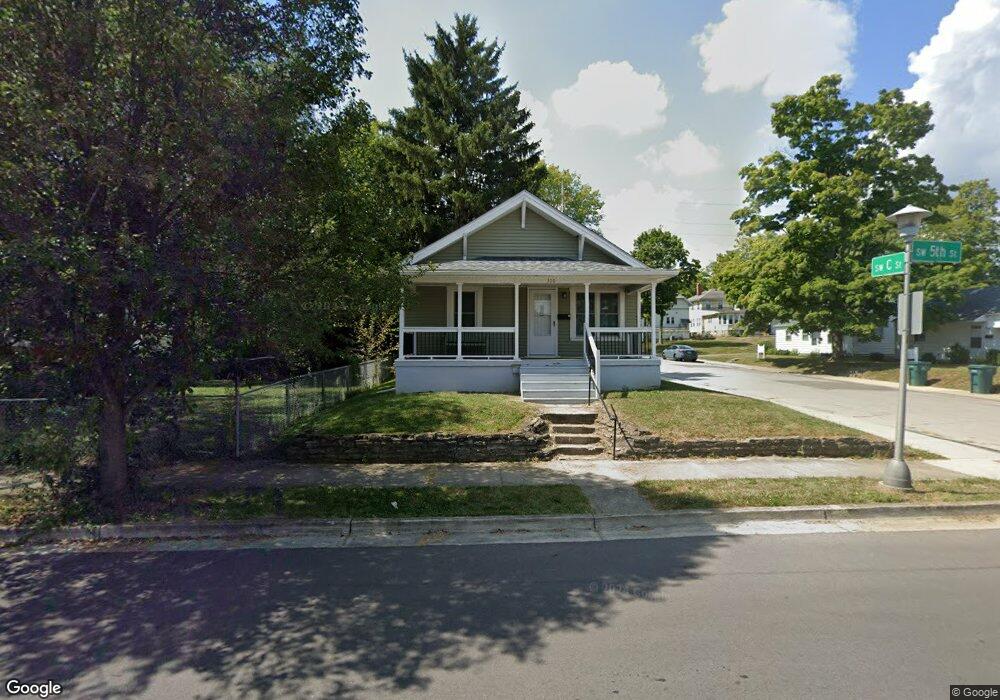
300 SW 5th St Richmond, IN 47374
Estimated Value: $98,082 - $115,000
2
Beds
1
Bath
936
Sq Ft
$113/Sq Ft
Est. Value
About This Home
This home is located at 300 SW 5th St, Richmond, IN 47374 and is currently estimated at $105,771, approximately $113 per square foot. 300 SW 5th St is a home located in Wayne County with nearby schools including Westview Elementary School, Dennis Middle School, and Richmond High School.
Ownership History
Date
Name
Owned For
Owner Type
Purchase Details
Closed on
May 5, 2023
Sold by
Elstro Family Revocable Trust
Bought by
Bethany Theological Seminary Inc
Current Estimated Value
Purchase Details
Closed on
May 7, 2020
Sold by
Mse Properties Llc
Bought by
Elstro Ft
Purchase Details
Closed on
Jan 3, 2014
Sold by
Howard J Elstro Trust
Bought by
Mse Properties Llc
Purchase Details
Closed on
Dec 13, 2013
Sold by
Elstro H J
Bought by
Elstro Howard J and Howard J Elstro Trust
Purchase Details
Closed on
Jan 24, 2011
Sold by
Martine Mc Peak
Bought by
Elstro H J
Create a Home Valuation Report for This Property
The Home Valuation Report is an in-depth analysis detailing your home's value as well as a comparison with similar homes in the area
Home Values in the Area
Average Home Value in this Area
Purchase History
| Date | Buyer | Sale Price | Title Company |
|---|---|---|---|
| Bethany Theological Seminary Inc | -- | None Listed On Document | |
| Elstro Ft | -- | None Available | |
| Mse Properties Llc | -- | None Available | |
| Elstro Howard J | -- | None Available | |
| Elstro H J | -- | -- |
Source: Public Records
Tax History Compared to Growth
Tax History
| Year | Tax Paid | Tax Assessment Tax Assessment Total Assessment is a certain percentage of the fair market value that is determined by local assessors to be the total taxable value of land and additions on the property. | Land | Improvement |
|---|---|---|---|---|
| 2024 | $1,120 | $56,000 | $10,200 | $45,800 |
| 2023 | $984 | $49,200 | $8,900 | $40,300 |
| 2022 | $994 | $49,700 | $8,900 | $40,800 |
| 2021 | $910 | $45,500 | $8,900 | $36,600 |
| 2020 | $894 | $44,700 | $8,900 | $35,800 |
| 2019 | $862 | $43,100 | $8,900 | $34,200 |
| 2018 | $862 | $43,100 | $8,900 | $34,200 |
| 2017 | $892 | $44,600 | $8,900 | $35,700 |
| 2016 | $892 | $44,600 | $8,900 | $35,700 |
| 2014 | $882 | $44,100 | $8,900 | $35,200 |
| 2013 | $882 | $42,900 | $8,900 | $34,000 |
Source: Public Records
Map
Nearby Homes