Estimated Value: $420,000 - $475,000
3
Beds
2
Baths
1,316
Sq Ft
$344/Sq Ft
Est. Value
About This Home
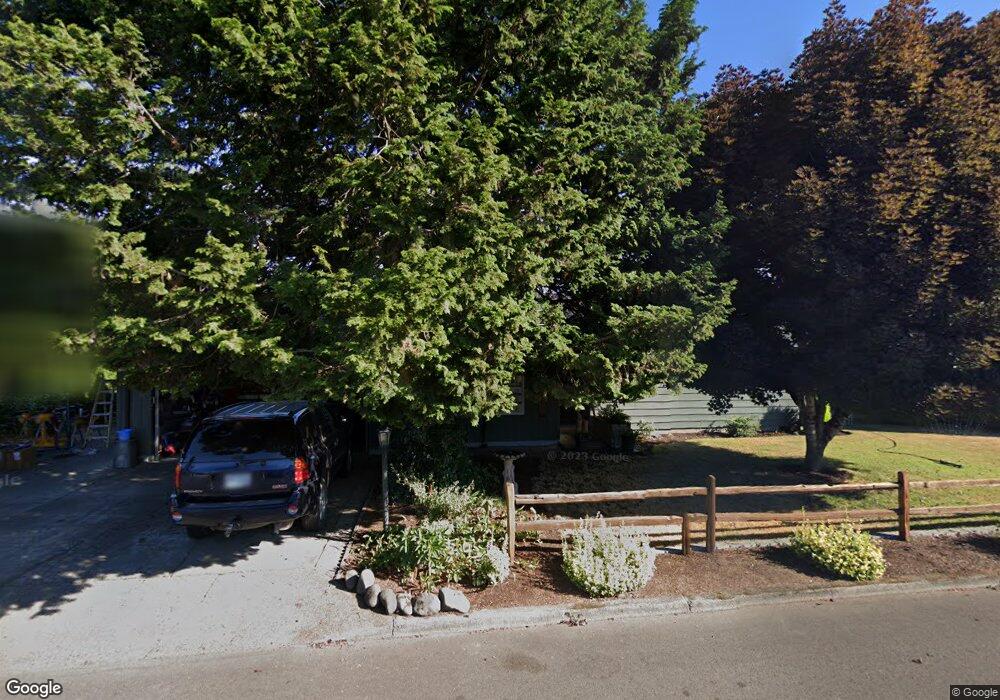
This home is located at 300 SW 7th Ave, Canby, OR 97013 and is currently estimated at $452,095, approximately $343 per square foot. 300 SW 7th Ave is a home located in Clackamas County with nearby schools including Josefa L. Sambrano Elementary School, Philander Lee Elementary School, and Baker Prairie Middle School.
Ownership History
Date
Name
Owned For
Owner Type
Purchase Details
Closed on
Jul 7, 2011
Sold by
Graham Randy C and Aamodt Lars M
Bought by
Graham Randy C
Current Estimated Value
Home Financials for this Owner
Home Financials are based on the most recent Mortgage that was taken out on this home.
Original Mortgage
$146,000
Interest Rate
4.46%
Mortgage Type
New Conventional
Purchase Details
Closed on
Sep 23, 2003
Sold by
Aamodt Lars M and Aamodt Elaine J
Bought by
Graham Randy C and Aamodt Lars M
Home Financials for this Owner
Home Financials are based on the most recent Mortgage that was taken out on this home.
Original Mortgage
$121,600
Interest Rate
6.17%
Mortgage Type
Unknown
Purchase Details
Closed on
Sep 12, 2003
Sold by
Aamodt Lars M and Aamodt Elaine J
Bought by
Aamodt Lars M and Aamodt Elaine J
Home Financials for this Owner
Home Financials are based on the most recent Mortgage that was taken out on this home.
Original Mortgage
$121,600
Interest Rate
6.17%
Mortgage Type
Unknown
Create a Home Valuation Report for This Property
The Home Valuation Report is an in-depth analysis detailing your home's value as well as a comparison with similar homes in the area
Home Values in the Area
Average Home Value in this Area
Purchase History
| Date | Buyer | Sale Price | Title Company |
|---|---|---|---|
| Graham Randy C | -- | None Available | |
| Graham Randy C | -- | Chicago Title Insurance Comp | |
| Aamodt Lars M | -- | Chicago |
Source: Public Records
Mortgage History
| Date | Status | Borrower | Loan Amount |
|---|---|---|---|
| Closed | Graham Randy C | $146,000 | |
| Closed | Graham Randy C | $121,600 |
Source: Public Records
Tax History Compared to Growth
Tax History
| Year | Tax Paid | Tax Assessment Tax Assessment Total Assessment is a certain percentage of the fair market value that is determined by local assessors to be the total taxable value of land and additions on the property. | Land | Improvement |
|---|---|---|---|---|
| 2025 | $3,720 | $209,962 | -- | -- |
| 2024 | $3,616 | $203,847 | -- | -- |
| 2023 | $3,616 | $197,910 | $0 | $0 |
| 2022 | $3,326 | $192,146 | $0 | $0 |
| 2021 | $3,202 | $186,550 | $0 | $0 |
| 2020 | $3,145 | $181,117 | $0 | $0 |
| 2019 | $2,995 | $175,842 | $0 | $0 |
| 2018 | $2,928 | $170,720 | $0 | $0 |
| 2017 | $2,854 | $165,748 | $0 | $0 |
| 2016 | $2,759 | $160,920 | $0 | $0 |
| 2015 | $2,664 | $156,233 | $0 | $0 |
| 2014 | $2,587 | $151,683 | $0 | $0 |
Source: Public Records
Map
Nearby Homes
- 481 S Holly St
- 574 S Ivy St
- 299 SW 3rd Ave
- 248 SE Township Rd
- 431 SW 3rd Ave
- 363 SE 7th Ave
- 385 SE Township Rd
- 486 S Knott St
- 331 SE 9th Ave
- 387 SE 7th Ave
- 1491 S Fir St Unit 18
- 1487 S Fir St Unit Lot17
- 1485 S Fir St Unit Lot 16
- 423 SE 7th Ave
- 201 SE 16th Ave
- 550 SE 5th Ave
- 1198 SW 1st Ave
- 582 S Maple St
- 1400 S Elm St Unit 91
- 620 SE 2nd Ave
- 289 SW 6th Place
- 290 SW 7th Ave
- 340 SW 7th Ave
- 317 SW 6th Place
- 325 SW 7th Ave
- 255 SW 7th Ave
- 345 SW 7th Ave
- 255 SW 6th Place
- 680 S Fir St
- 390 SW 7th Ave
- 230 SW 7th Ave
- 296 SW 8th Ave
- 245 SW 7th Ave
- 335 SW 6th Place
- 272 SW 6th Place
- 801 S Grant St
- 270 SW 8th Ave
- 714 S Fir St
- 221 SW 6th Place
- 260 SW 6th Place