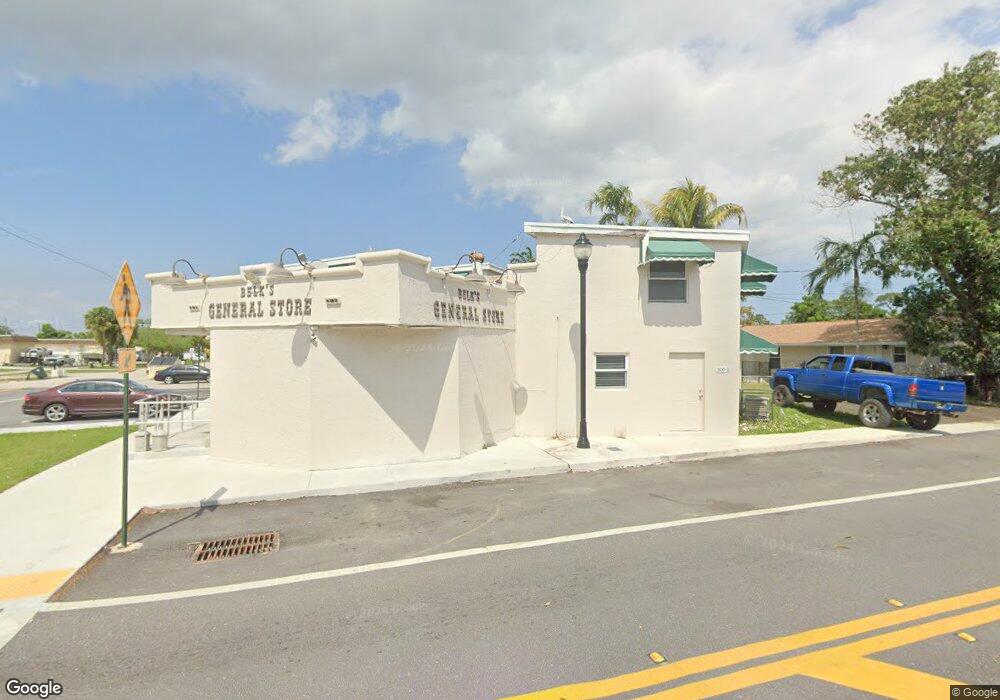
300 Swain Blvd Greenacres, FL 33463
Estimated Value: $1,414,983
--
Bed
4
Baths
1,956
Sq Ft
$723/Sq Ft
Est. Value
About This Home
This home is located at 300 Swain Blvd, Greenacres, FL 33463 and is currently estimated at $1,414,983, approximately $723 per square foot. 300 Swain Blvd is a home located in Palm Beach County with nearby schools including Greenacres Elementary School, John I. Leonard High School, and L C Swain Middle School.
Ownership History
Date
Name
Owned For
Owner Type
Purchase Details
Closed on
Sep 6, 2024
Sold by
300 Swain Llc
Bought by
Rh Property Mart Inc
Current Estimated Value
Purchase Details
Closed on
Apr 18, 2014
Sold by
Proctor Douglas K and Rachalis Jacqueline V
Bought by
300 Swain Llc
Purchase Details
Closed on
Jun 6, 2011
Sold by
Proctor Douglas Kristopher
Bought by
Rachalis Jacqueline
Purchase Details
Closed on
May 6, 2010
Sold by
Rachalis Jacqueline V
Bought by
Proctor Douglas Kristopher
Purchase Details
Closed on
Nov 22, 2002
Sold by
Belk Mary E
Bought by
Proctor Douglas K
Home Financials for this Owner
Home Financials are based on the most recent Mortgage that was taken out on this home.
Original Mortgage
$221,000
Interest Rate
5.95%
Mortgage Type
Purchase Money Mortgage
Create a Home Valuation Report for This Property
The Home Valuation Report is an in-depth analysis detailing your home's value as well as a comparison with similar homes in the area
Home Values in the Area
Average Home Value in this Area
Purchase History
| Date | Buyer | Sale Price | Title Company |
|---|---|---|---|
| Rh Property Mart Inc | $1,400,000 | None Listed On Document | |
| 300 Swain Llc | $250,000 | Attorney | |
| Rachalis Jacqueline | $50,000 | Attorney | |
| Proctor Douglas Kristopher | $50,000 | Attorney | |
| Proctor Douglas K | $340,000 | -- |
Source: Public Records
Mortgage History
| Date | Status | Borrower | Loan Amount |
|---|---|---|---|
| Previous Owner | Proctor Douglas K | $221,000 | |
| Closed | Proctor Douglas K | $40,000 |
Source: Public Records
Tax History Compared to Growth
Tax History
| Year | Tax Paid | Tax Assessment Tax Assessment Total Assessment is a certain percentage of the fair market value that is determined by local assessors to be the total taxable value of land and additions on the property. | Land | Improvement |
|---|---|---|---|---|
| 2024 | $14,343 | $549,366 | -- | -- |
| 2023 | $13,700 | $524,858 | $0 | $0 |
| 2022 | $12,793 | $477,144 | -- | -- |
| 2021 | $11,993 | $433,767 | $102,454 | $331,313 |
| 2020 | $11,772 | $422,569 | $102,454 | $320,115 |
| 2019 | $11,680 | $412,495 | $97,575 | $314,920 |
| 2018 | $10,448 | $372,906 | $81,963 | $290,943 |
| 2017 | $9,908 | $365,367 | $78,060 | $287,307 |
| 2016 | $9,438 | $336,322 | $0 | $0 |
| 2015 | $8,990 | $305,747 | $0 | $0 |
| 2014 | $10,140 | $360,750 | $0 | $0 |
Source: Public Records
Map
Nearby Homes
- 321 Broward Ave
- 256 Broward Ave
- 228 Martin Ave
- 317 Perry Ave
- 260 Jackson Ave
- 229 Perry Ave
- 409 Perry Ave
- 332 Fleming Ave
- 3756 Whitney Park Ln
- 4865 Dillion St
- 4857 Dillion St
- 4849 Dillion St
- 4845 Dillion St
- 4841 Dillion St
- 4837 Dillion St
- 4833 Dillion St
- 4829 Dillion St
- 124 Jackson Ave
- 217 Fleming Ave
- 4865 Dillon St
- 312 Swain Blvd
- 316 Swain Blvd
- 268 Swain Blvd
- 301 Broward Ave
- 307 Broward Ave
- 309-315 Swain Blvd
- 320 Swain Blvd Unit E
- 320 Swain Blvd
- 266 Swain Blvd
- 265 Broward Ave
- 317 Broward Ave
- 305 Swain Blvd
- 309 Swain Blvd
- 311 Swain Blvd
- 313 Swain Blvd
- 261 Broward Ave
- 264 Swain Blvd
- 315 Swain Blvd
- 265 Swain Blvd
- 324 Swain Blvd