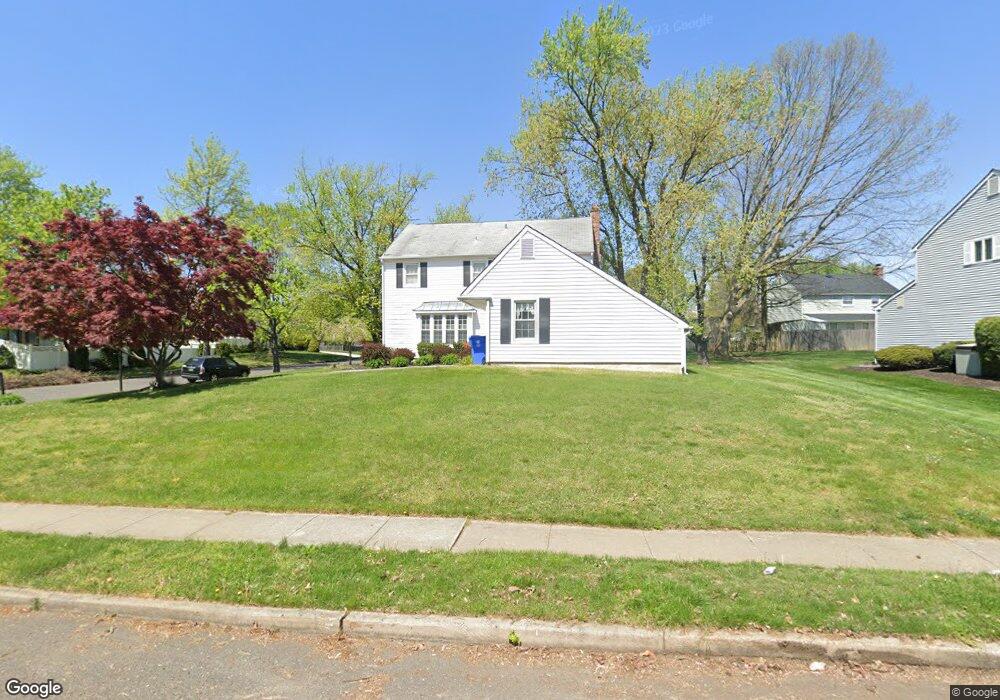
300 Tenby Chase Dr Delran, NJ 08075
Tenby Chase NeighborhoodEstimated Value: $503,000 - $516,000
--
Bed
--
Bath
2,120
Sq Ft
$240/Sq Ft
Est. Value
About This Home
This home is located at 300 Tenby Chase Dr, Delran, NJ 08075 and is currently estimated at $509,565, approximately $240 per square foot. 300 Tenby Chase Dr is a home located in Burlington County with nearby schools including Millbridge Elementary School, Delran Intermediate School, and Delran Middle School.
Ownership History
Date
Name
Owned For
Owner Type
Purchase Details
Closed on
Jun 20, 2008
Sold by
Costa Lucy J
Bought by
Martino Thomas J and Martino Heather
Current Estimated Value
Home Financials for this Owner
Home Financials are based on the most recent Mortgage that was taken out on this home.
Original Mortgage
$318,994
Outstanding Balance
$204,278
Interest Rate
6.01%
Mortgage Type
FHA
Estimated Equity
$305,287
Purchase Details
Closed on
Jul 9, 2004
Sold by
Costa Peter J and Costa Lucy J
Bought by
Costa Lucy J
Home Financials for this Owner
Home Financials are based on the most recent Mortgage that was taken out on this home.
Original Mortgage
$50,000
Interest Rate
5.36%
Mortgage Type
Credit Line Revolving
Create a Home Valuation Report for This Property
The Home Valuation Report is an in-depth analysis detailing your home's value as well as a comparison with similar homes in the area
Home Values in the Area
Average Home Value in this Area
Purchase History
| Date | Buyer | Sale Price | Title Company |
|---|---|---|---|
| Martino Thomas J | $324,000 | Integrity Title | |
| Costa Lucy J | -- | Certifield Title Corp |
Source: Public Records
Mortgage History
| Date | Status | Borrower | Loan Amount |
|---|---|---|---|
| Open | Martino Thomas J | $318,994 | |
| Previous Owner | Costa Lucy J | $50,000 | |
| Previous Owner | Costa Lucy J | $186,000 |
Source: Public Records
Tax History Compared to Growth
Tax History
| Year | Tax Paid | Tax Assessment Tax Assessment Total Assessment is a certain percentage of the fair market value that is determined by local assessors to be the total taxable value of land and additions on the property. | Land | Improvement |
|---|---|---|---|---|
| 2025 | $10,262 | $258,100 | $58,500 | $199,600 |
| 2024 | $10,169 | $258,100 | $58,500 | $199,600 |
| 2023 | $10,169 | $258,100 | $58,500 | $199,600 |
| 2022 | $10,038 | $258,100 | $58,500 | $199,600 |
| 2021 | $10,043 | $258,100 | $58,500 | $199,600 |
| 2020 | $10,022 | $258,100 | $58,500 | $199,600 |
| 2019 | $9,929 | $258,100 | $58,500 | $199,600 |
| 2018 | $9,764 | $258,100 | $58,500 | $199,600 |
| 2017 | $9,609 | $258,100 | $58,500 | $199,600 |
| 2016 | $9,467 | $258,100 | $58,500 | $199,600 |
| 2015 | $9,310 | $258,100 | $58,500 | $199,600 |
| 2014 | $8,904 | $258,100 | $58,500 | $199,600 |
Source: Public Records
Map
Nearby Homes
- 128 Dorado Dr
- 164 Fox Chase Dr
- 142 Fox Chase Dr
- 228 Aqua Ln
- 110 Kathleen Ave
- 53 Princeton Dr
- 60 Notre Dame Dr
- 31 Cornell Dr
- 139 Patricia Ave
- 347 Tom Brown Rd
- 343 Tom Brown Rd
- 4327 Bridgeboro Rd
- 29 Haines Mill Rd
- 415 Bridgeboro Rd
- 2408 New Albany Rd
- 2204 New Albany Rd
- 2209 New Albany Rd
- 103 Congressional Ct
- 693 Garwood Rd
- 0 0 Swarthmore Dr
- 302 Tenby Chase Dr
- 127 Coopers Kill Rd
- 298 Tenby Chase Dr
- 297 Tenby Chase Dr
- 125 Coopers Kill Rd
- 304 Tenby Chase Dr
- 129 Coopers Kill Rd
- 299 Tenby Chase Dr
- 301 Tenby Chase Dr
- 295 Tenby Chase Dr
- 123 Coopers Kill Rd
- 306 Tenby Chase Dr
- 296 Tenby Chase Dr
- 131 Coopers Kill Rd
- 303 Tenby Chase Dr
- 124 Coopers Kill Rd
- 126 Coopers Kill Rd
- 121 Coopers Kill Rd
- 122 Coopers Kill Rd
- 308 Tenby Chase Dr