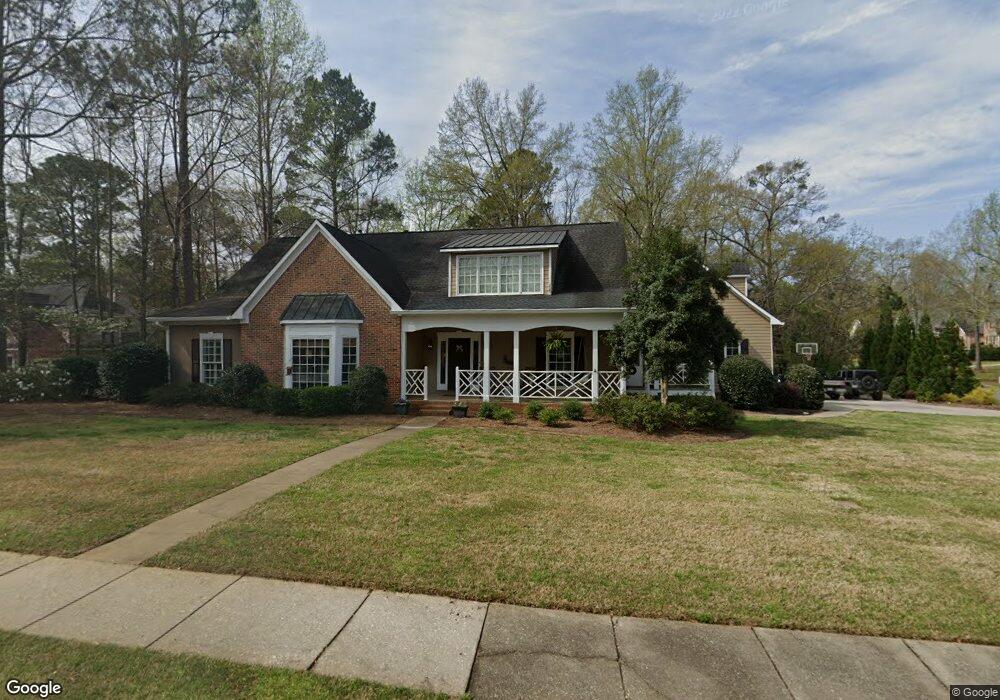
300 Treyburne Ct Macon, GA 31210
Estimated Value: $616,000 - $671,000
6
Beds
6
Baths
4,406
Sq Ft
$148/Sq Ft
Est. Value
About This Home
This home is located at 300 Treyburne Ct, Macon, GA 31210 and is currently estimated at $651,206, approximately $147 per square foot. 300 Treyburne Ct is a home located in Bibb County with nearby schools including Carter Elementary School, Howard Middle School, and Howard High School.
Ownership History
Date
Name
Owned For
Owner Type
Purchase Details
Closed on
May 23, 2019
Sold by
Groves Joshua R and Groves Pamela J
Bought by
Synovus Bank
Current Estimated Value
Purchase Details
Closed on
Jul 30, 2009
Sold by
Smith W Vaughan and Smith Elizabeth N
Bought by
Groves Joshua R and Groves Pamela J
Home Financials for this Owner
Home Financials are based on the most recent Mortgage that was taken out on this home.
Original Mortgage
$275,793
Interest Rate
5.37%
Mortgage Type
FHA
Purchase Details
Closed on
Jul 8, 2005
Sold by
Foshee Harold D and Foshee Saynor P
Bought by
Smith W Vaughan and Smith Elizabeth N
Home Financials for this Owner
Home Financials are based on the most recent Mortgage that was taken out on this home.
Original Mortgage
$244,800
Interest Rate
5.57%
Mortgage Type
New Conventional
Purchase Details
Closed on
Jan 17, 1997
Create a Home Valuation Report for This Property
The Home Valuation Report is an in-depth analysis detailing your home's value as well as a comparison with similar homes in the area
Home Values in the Area
Average Home Value in this Area
Purchase History
| Date | Buyer | Sale Price | Title Company |
|---|---|---|---|
| Synovus Bank | -- | None Available | |
| Groves Joshua R | $336,000 | None Available | |
| Smith W Vaughan | $306,000 | None Available | |
| -- | $224,000 | -- |
Source: Public Records
Mortgage History
| Date | Status | Borrower | Loan Amount |
|---|---|---|---|
| Previous Owner | Groves Joshua R | $275,793 | |
| Previous Owner | Smith W Vaughan | $244,800 |
Source: Public Records
Tax History Compared to Growth
Tax History
| Year | Tax Paid | Tax Assessment Tax Assessment Total Assessment is a certain percentage of the fair market value that is determined by local assessors to be the total taxable value of land and additions on the property. | Land | Improvement |
|---|---|---|---|---|
| 2025 | $4,938 | $207,925 | $23,360 | $184,565 |
| 2024 | $5,103 | $207,925 | $23,360 | $184,565 |
| 2023 | $5,952 | $207,925 | $23,360 | $184,565 |
| 2022 | $6,125 | $183,903 | $24,753 | $159,150 |
| 2021 | $6,353 | $174,174 | $24,032 | $150,142 |
| 2020 | $6,490 | $174,174 | $24,032 | $150,142 |
| 2019 | $6,544 | $174,174 | $24,032 | $150,142 |
| 2018 | $10,202 | $174,174 | $24,032 | $150,142 |
| 2017 | $6,263 | $174,174 | $24,032 | $150,142 |
| 2016 | $5,784 | $174,174 | $24,032 | $150,142 |
| 2015 | $5,916 | $127,794 | $24,032 | $103,761 |
| 2014 | $5,925 | $127,794 | $24,032 | $103,761 |
Source: Public Records
Map
Nearby Homes
- 4971 Ayers Rd
- 117 Legare Ct
- 1153 Saint Andrews Dr
- 715 Ivy Brook Way
- 776 Ivy Brook Way
- 973 Fieldstone Dr
- 785 Ivy Brook Way
- 631 Ivy Brook Way
- 2006 Fall Harvest Dr Unit LOT 278
- 2002 Fall Harvest Dr Unit LOT 280
- 2006 Fall Harvest Dr
- 2002 Fall Harvest Dr
- 2008 Fall Harvest Dr Unit LOT 277
- 2004 Fall Harvest Dr
- 2004 Fall Harvest Dr Unit LOT 279
- 304 Treyburne Ct
- 0 Treyburne Ct Unit 8820769
- 0 Treyburne Ct
- 301 Treyburne Ct
- 125 Treyburne Way
- 121 Treyburne Way
- 308 Treyburne Ct
- 305 Treyburne Ct
- 201 Hampton Ct
- 117 Treyburne Way
- 205 Hampton Ct
- 128 Treyburne Way
- 113 Treyburne Way
- 129 Treyburne Way
- 209 Hampton Ct
- 309 Treyburne Ct
- 312 Treyburne Ct
- 109 Treyburne Way Unit 3
- 109 Treyburne Way
- 130 Treyburne Way