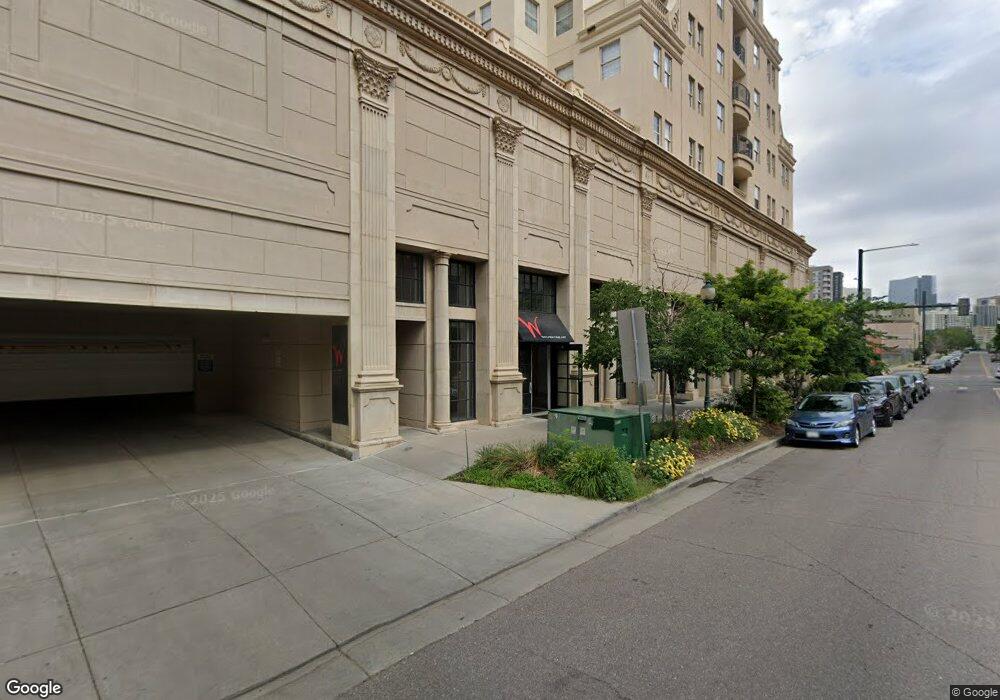
Prado Condos 300 W 11th Ave Unit 15D Denver, CO 80204
Golden Triangle NeighborhoodEstimated Value: $475,000 - $494,000
2
Beds
2
Baths
1,084
Sq Ft
$447/Sq Ft
Est. Value
About This Home
This home is located at 300 W 11th Ave Unit 15D, Denver, CO 80204 and is currently estimated at $484,921, approximately $447 per square foot. 300 W 11th Ave Unit 15D is a home located in Denver County with nearby schools including Greenlee Elementary School, Kepner Beacon Middle School, and West High School.
Ownership History
Date
Name
Owned For
Owner Type
Purchase Details
Closed on
Jun 24, 2021
Sold by
Space Works Llc
Bought by
Pahl Darryl James and Ondrejcek Lisa Anne
Current Estimated Value
Home Financials for this Owner
Home Financials are based on the most recent Mortgage that was taken out on this home.
Original Mortgage
$388,800
Outstanding Balance
$352,010
Interest Rate
2.9%
Mortgage Type
New Conventional
Estimated Equity
$132,911
Purchase Details
Closed on
Sep 12, 2012
Sold by
Monfort Runyan Llc
Bought by
Space Works Llc
Purchase Details
Closed on
Jul 30, 2012
Sold by
The Myra H Monfort Runyan Revocable Livi
Bought by
Monfort Runyan Myra H
Purchase Details
Closed on
Jul 3, 2012
Sold by
Monfort Runyan Myra H
Bought by
Monfort Runyan Llc
Purchase Details
Closed on
Feb 4, 2005
Sold by
Monfort Myra H
Bought by
Myra H Monfort Revocable Living Trust
Purchase Details
Closed on
Feb 14, 2002
Sold by
Prado Condominium Corp
Bought by
Monfort Myra
Create a Home Valuation Report for This Property
The Home Valuation Report is an in-depth analysis detailing your home's value as well as a comparison with similar homes in the area
Home Values in the Area
Average Home Value in this Area
Purchase History
| Date | Buyer | Sale Price | Title Company |
|---|---|---|---|
| Pahl Darryl James | $505,000 | Fidelity National Title | |
| Space Works Llc | $255,000 | None Available | |
| Monfort Runyan Myra H | -- | None Available | |
| Monfort Runyan Llc | -- | None Available | |
| Myra H Monfort Revocable Living Trust | -- | -- | |
| Monfort Myra | $371,061 | First American Heritage Titl |
Source: Public Records
Mortgage History
| Date | Status | Borrower | Loan Amount |
|---|---|---|---|
| Open | Pahl Darryl James | $388,800 |
Source: Public Records
Tax History Compared to Growth
Tax History
| Year | Tax Paid | Tax Assessment Tax Assessment Total Assessment is a certain percentage of the fair market value that is determined by local assessors to be the total taxable value of land and additions on the property. | Land | Improvement |
|---|---|---|---|---|
| 2024 | $2,501 | $31,580 | $570 | $31,010 |
| 2023 | $2,447 | $31,580 | $570 | $31,010 |
| 2022 | $2,436 | $30,630 | $4,010 | $26,620 |
| 2021 | $2,436 | $31,510 | $4,130 | $27,380 |
| 2020 | $2,159 | $29,100 | $1,980 | $27,120 |
| 2019 | $2,099 | $29,100 | $1,980 | $27,120 |
| 2018 | $2,189 | $28,290 | $1,660 | $26,630 |
| 2017 | $2,182 | $28,290 | $1,660 | $26,630 |
| 2016 | $2,032 | $24,920 | $1,560 | $23,360 |
| 2015 | $1,947 | $24,920 | $1,560 | $23,360 |
| 2014 | $1,348 | $16,230 | $1,106 | $15,124 |
Source: Public Records
About Prado Condos
Map
Nearby Homes
- 300 W 11th Ave Unit 5I
- 300 W 11th Ave Unit 18C
- 300 W 11th Ave Unit 5B
- 300 W 11th Ave Unit 6H
- 300 W 11th Ave Unit 10G
- 300 W 11th Ave Unit 10C
- 1090 Cherokee St Unit 301
- 1100 Cherokee St Unit 304
- 1140 Cherokee St Unit 401
- 290 W 12th Ave Unit 205
- 1200 Cherokee St Unit 206
- 475 W 12th Ave Unit 11A
- 475 W 12th Ave Unit 6B
- 1014 Acoma St
- 601 W 11th Ave Unit 910
- 55 W 12th Ave Unit 408
- 1200 Acoma St Unit 303
- 1200 Acoma St Unit 203
- 1303 Delaware St
- 930 Acoma St Unit 212
- 300 W 11th Ave Unit 7-I
- 300 W 11th Ave Unit P85
- 300 W 11th Ave Unit P84
- 300 W 11th Ave Unit 19B
- 300 W 11th Ave Unit 19A
- 300 W 11th Ave Unit 18D
- 300 W 11th Ave Unit 8G
- 300 W 11th Ave Unit 18A
- 300 W 11th Ave Unit 17F
- 300 W 11th Ave Unit 17E
- 300 W 11th Ave Unit 17D
- 300 W 11th Ave Unit 17C
- 300 W 11th Ave Unit 17B
- 300 W 11th Ave Unit 17A
- 300 W 11th Ave Unit 16F
- 300 W 11th Ave Unit 16E
- 300 W 11th Ave Unit 16D
- 300 W 11th Ave Unit 16C
- 300 W 11th Ave Unit 16B
- 300 W 11th Ave Unit 16A