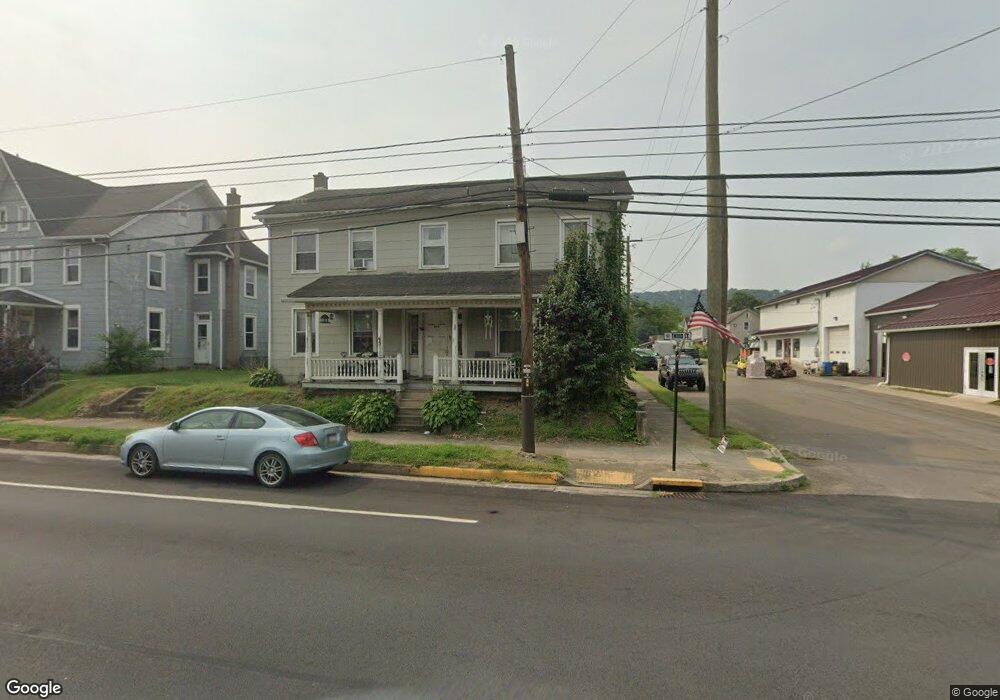
300 W 3rd St Nescopeck, PA 18635
Estimated Value: $78,000 - $264,000
--
Bed
--
Bath
2,496
Sq Ft
$73/Sq Ft
Est. Value
About This Home
This home is located at 300 W 3rd St, Nescopeck, PA 18635 and is currently estimated at $182,777, approximately $73 per square foot. 300 W 3rd St is a home with nearby schools including Berwick Area High School, Holy Family Consolidated School, and New Story School.
Ownership History
Date
Name
Owned For
Owner Type
Purchase Details
Closed on
Nov 18, 2020
Sold by
Onemain Financial Services Inc
Bought by
Longenberger William L
Current Estimated Value
Home Financials for this Owner
Home Financials are based on the most recent Mortgage that was taken out on this home.
Original Mortgage
$40,000
Outstanding Balance
$35,530
Interest Rate
2.7%
Mortgage Type
Commercial
Estimated Equity
$147,247
Purchase Details
Closed on
Oct 24, 2019
Sold by
Bogart Jerri A and Silva Joel R
Bought by
Onemain Financial Services Inc
Purchase Details
Closed on
Apr 30, 2004
Bought by
Silva Joel R
Create a Home Valuation Report for This Property
The Home Valuation Report is an in-depth analysis detailing your home's value as well as a comparison with similar homes in the area
Home Values in the Area
Average Home Value in this Area
Purchase History
| Date | Buyer | Sale Price | Title Company |
|---|---|---|---|
| Longenberger William L | $40,000 | Servicelink | |
| Onemain Financial Services Inc | $2,999 | None Available | |
| Silva Joel R | $40,000 | -- |
Source: Public Records
Mortgage History
| Date | Status | Borrower | Loan Amount |
|---|---|---|---|
| Open | Longenberger William L | $40,000 |
Source: Public Records
Tax History Compared to Growth
Tax History
| Year | Tax Paid | Tax Assessment Tax Assessment Total Assessment is a certain percentage of the fair market value that is determined by local assessors to be the total taxable value of land and additions on the property. | Land | Improvement |
|---|---|---|---|---|
| 2025 | $1,496 | $66,600 | $23,000 | $43,600 |
| 2024 | $1,451 | $66,600 | $23,000 | $43,600 |
| 2023 | $1,394 | $66,600 | $23,000 | $43,600 |
| 2022 | $1,381 | $66,600 | $23,000 | $43,600 |
| 2021 | $1,275 | $66,600 | $23,000 | $43,600 |
| 2020 | $1,236 | $66,600 | $23,000 | $43,600 |
| 2019 | $1,227 | $66,600 | $23,000 | $43,600 |
| 2018 | $1,218 | $66,600 | $23,000 | $43,600 |
| 2017 | $1,266 | $66,600 | $23,000 | $43,600 |
| 2016 | -- | $66,600 | $23,000 | $43,600 |
| 2015 | -- | $66,600 | $23,000 | $43,600 |
| 2014 | -- | $66,600 | $23,000 | $43,600 |
Source: Public Records
Map
Nearby Homes