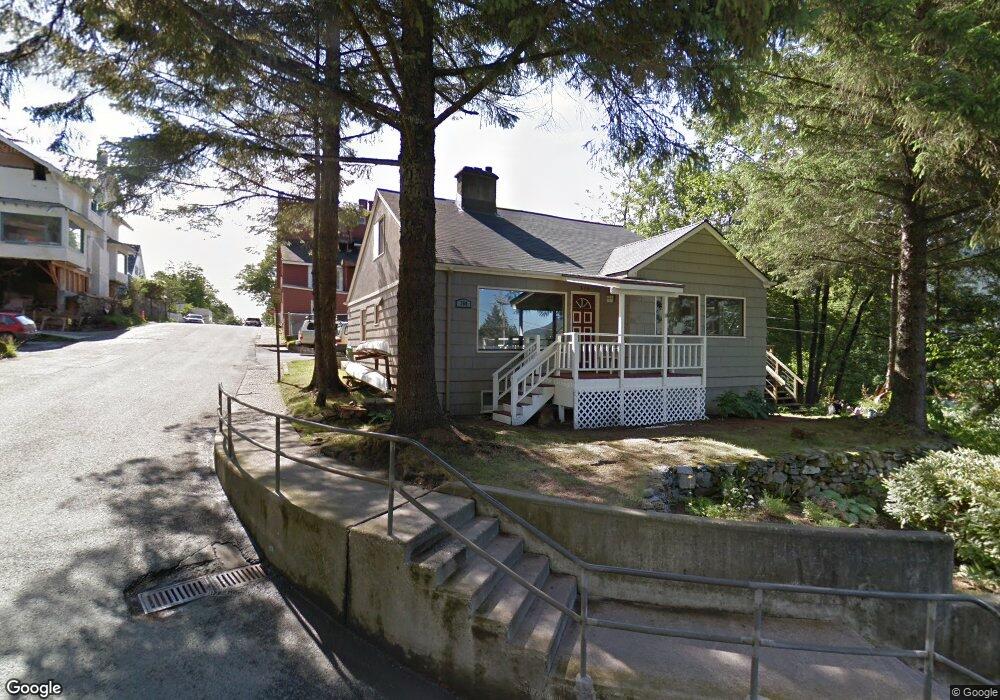
300 W 9th St Juneau, AK 99801
Downtown Juneau NeighborhoodEstimated Value: $143,000 - $716,680
4
Beds
4
Baths
1,827
Sq Ft
$294/Sq Ft
Est. Value
About This Home
This home is located at 300 W 9th St, Juneau, AK 99801 and is currently estimated at $536,920, approximately $293 per square foot. 300 W 9th St is a home located in Juneau City and Borough with nearby schools including Harborview Elementary School, Dzantik'i Heeni Middle School, and Juneau Community Charter School.
Ownership History
Date
Name
Owned For
Owner Type
Purchase Details
Closed on
Dec 23, 2002
Sold by
Blazer Rexford Sydney
Bought by
Wessen Douglas J
Current Estimated Value
Home Financials for this Owner
Home Financials are based on the most recent Mortgage that was taken out on this home.
Original Mortgage
$275,500
Outstanding Balance
$116,551
Interest Rate
6.03%
Estimated Equity
$420,369
Create a Home Valuation Report for This Property
The Home Valuation Report is an in-depth analysis detailing your home's value as well as a comparison with similar homes in the area
Home Values in the Area
Average Home Value in this Area
Purchase History
| Date | Buyer | Sale Price | Title Company |
|---|---|---|---|
| Wessen Douglas J | -- | Title Insurance Agency |
Source: Public Records
Mortgage History
| Date | Status | Borrower | Loan Amount |
|---|---|---|---|
| Open | Wessen Douglas J | $275,500 |
Source: Public Records
Tax History Compared to Growth
Tax History
| Year | Tax Paid | Tax Assessment Tax Assessment Total Assessment is a certain percentage of the fair market value that is determined by local assessors to be the total taxable value of land and additions on the property. | Land | Improvement |
|---|---|---|---|---|
| 2025 | $5,232 | $660,900 | $173,500 | $487,400 |
| 2024 | $5,195 | $667,400 | $173,500 | $493,900 |
| 2023 | $5,355 | $677,100 | $173,500 | $503,600 |
| 2022 | $4,267 | $554,100 | $157,800 | $396,300 |
| 2021 | $5,230 | $495,300 | $157,800 | $337,500 |
| 2020 | $5,145 | $482,600 | $157,800 | $324,800 |
| 2019 | $4,670 | $438,070 | $150,624 | $287,446 |
| 2018 | $4,580 | $438,070 | $150,624 | $287,446 |
| 2017 | $4,580 | $442,494 | $152,145 | $290,349 |
| 2016 | $4,580 | $429,606 | $147,714 | $281,892 |
| 2015 | -- | $401,500 | $138,050 | $263,450 |
| 2014 | -- | $399,900 | $137,500 | $262,400 |
Source: Public Records
Map
Nearby Homes
- 113 5th Street Stairs
- 831 Basin Rd
- 713 W 12th St
- 800 F St
- 421 Judy Ln
- 356 S Franklin St
- 3030 Foster Ave
- 0 Pioneer Ave
- 3185 Pioneer Ave
- 2969 Foster Ave
- 2753 John St
- 2751 David St
- 3012 Goodwin Rd
- 3005 Goodwin Rd
- 2624 John St
- 2551 Vista Dr Unit 102-C
- NHN Vista Dr
- 2214 Raven Rd
- 1940 Sutherland Dr
- 2187 Crow Hill Dr