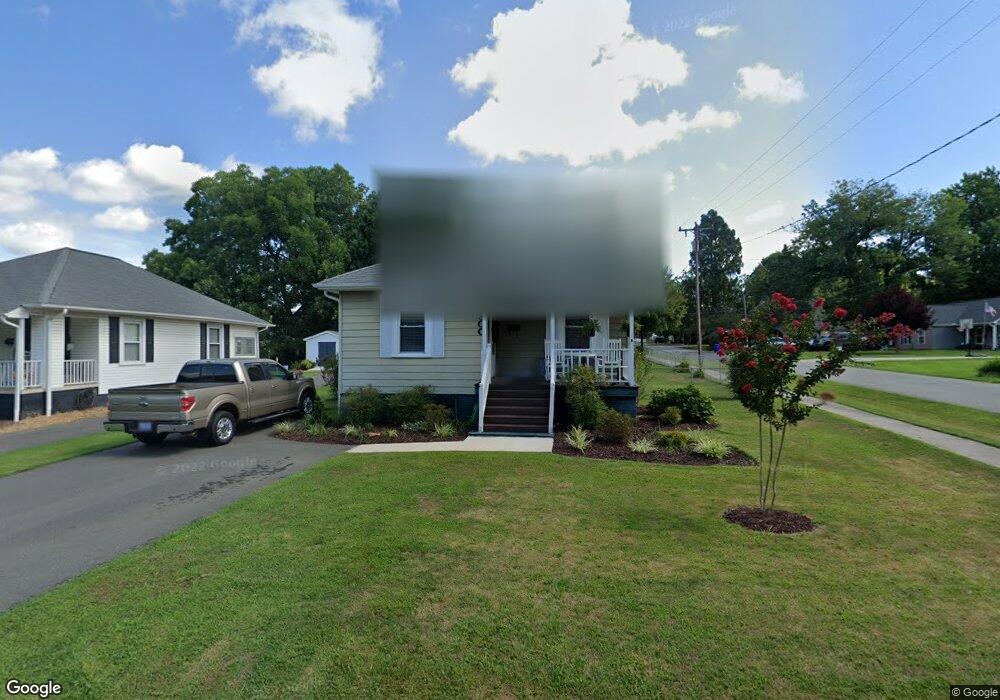
300 W Austin St Mebane, NC 27302
Estimated Value: $213,000 - $262,000
3
Beds
1
Bath
1,056
Sq Ft
$223/Sq Ft
Est. Value
About This Home
This home is located at 300 W Austin St, Mebane, NC 27302 and is currently estimated at $235,465, approximately $222 per square foot. 300 W Austin St is a home located in Alamance County with nearby schools including South Mebane Elementary School, Woodlawn Middle School, and Eastern Alamance High School.
Ownership History
Date
Name
Owned For
Owner Type
Purchase Details
Closed on
Mar 25, 2025
Sold by
Weaver Family Irrevocable Trust and Van Carver Andy
Bought by
Vancarver Andy
Current Estimated Value
Purchase Details
Closed on
Aug 23, 2007
Sold by
Langbeen Builders Inc
Bought by
Weaver Charlotte R
Home Financials for this Owner
Home Financials are based on the most recent Mortgage that was taken out on this home.
Original Mortgage
$48,750
Interest Rate
6.65%
Mortgage Type
New Conventional
Purchase Details
Closed on
Nov 30, 1998
Sold by
Bankers Trust Co Of Calif
Bought by
Florence Bobby
Home Financials for this Owner
Home Financials are based on the most recent Mortgage that was taken out on this home.
Original Mortgage
$41,600
Interest Rate
6.77%
Create a Home Valuation Report for This Property
The Home Valuation Report is an in-depth analysis detailing your home's value as well as a comparison with similar homes in the area
Home Values in the Area
Average Home Value in this Area
Purchase History
| Date | Buyer | Sale Price | Title Company |
|---|---|---|---|
| Vancarver Andy | -- | None Listed On Document | |
| Vancarver Andy | -- | None Listed On Document | |
| Weaver Charlotte R | $69,000 | -- | |
| Florence Bobby | $52,000 | -- |
Source: Public Records
Mortgage History
| Date | Status | Borrower | Loan Amount |
|---|---|---|---|
| Previous Owner | Weaver Charlotte R | $48,750 | |
| Previous Owner | Florence Bobby | $41,600 |
Source: Public Records
Tax History Compared to Growth
Tax History
| Year | Tax Paid | Tax Assessment Tax Assessment Total Assessment is a certain percentage of the fair market value that is determined by local assessors to be the total taxable value of land and additions on the property. | Land | Improvement |
|---|---|---|---|---|
| 2025 | $1,652 | $191,215 | $50,000 | $141,215 |
| 2024 | $1,604 | $191,215 | $50,000 | $141,215 |
| 2023 | $1,526 | $191,215 | $50,000 | $141,215 |
| 2022 | $1,002 | $89,902 | $35,000 | $54,902 |
| 2021 | $1,011 | $89,902 | $35,000 | $54,902 |
| 2020 | $1,020 | $89,902 | $35,000 | $54,902 |
| 2019 | $1,025 | $89,902 | $35,000 | $54,902 |
| 2018 | $0 | $89,902 | $35,000 | $54,902 |
| 2017 | $944 | $89,902 | $35,000 | $54,902 |
| 2016 | $840 | $78,496 | $30,000 | $48,496 |
| 2015 | $453 | $78,496 | $30,000 | $48,496 |
| 2014 | -- | $78,496 | $30,000 | $48,496 |
Source: Public Records
Map
Nearby Homes
- 0 Dyson Dr Unit TBD Dyson 2519207
- 415 S Third St
- 413 Mckinley Place
- 308 W Jackson St
- 421 W Holt St
- 605 Roosevelt St
- 456 Stonewall Dr
- 213 Beauregard Ln
- 106 Circle Dr
- 104 E Wilson St
- Lot# 2 Highway 70 E
- 714 W Mckinley St
- 619 S Fifth St
- 402 W Clay St
- 0 Roosevelt St
- 421 E Webb St
- 1005 Stuart Dr
- 0 E Webb St
- 0 S Fifth St
- # 0 S Fifth St
- 302 W Austin St
- 304 W Austin St
- 507 S Second St
- 503 S 2nd St
- 301 W Mckinley St
- 303 W Mckinley St
- 303 W Mckinley St
- 306 W Austin St
- 301 W Austin St
- 505 S Second St
- 303 W Austin St
- 503 S Second St
- 305 W Austin St
- 307 W Mckinley St
- 601 S Second St
- 308 W Austin St
- 207 W Mckinley St
- 309 W Mckinley St
- 603 S Second St
- 310 W Austin St