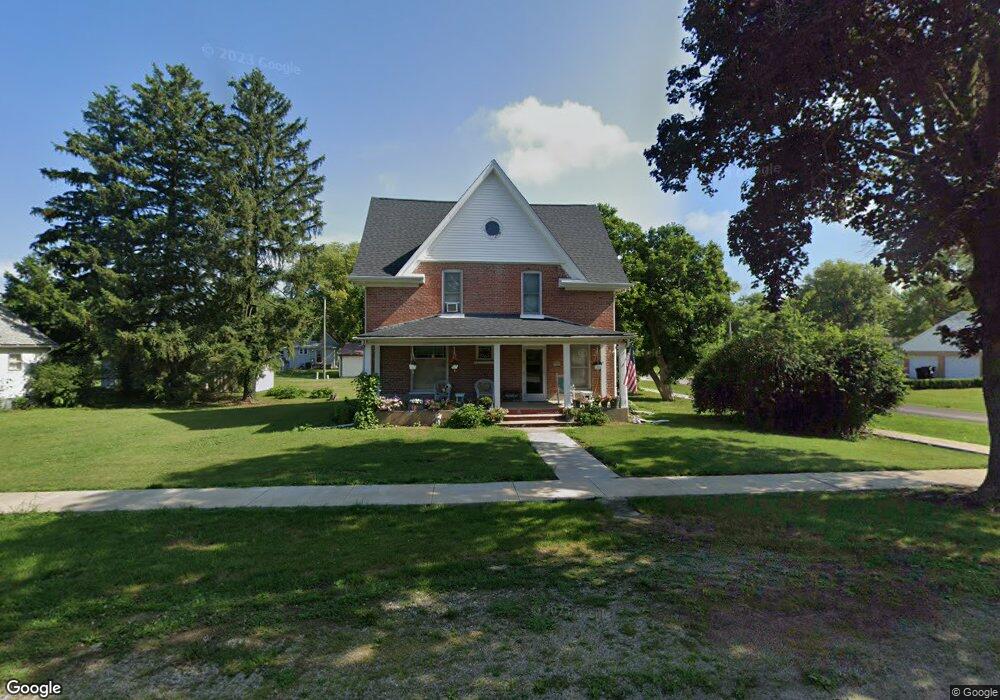
300 W Charles St Mc Lean, IL 61754
Estimated Value: $113,000 - $144,000
--
Bed
2
Baths
960
Sq Ft
$132/Sq Ft
Est. Value
About This Home
This home is located at 300 W Charles St, Mc Lean, IL 61754 and is currently estimated at $126,966, approximately $132 per square foot. 300 W Charles St is a home located in McLean County with nearby schools including Olympia High School.
Ownership History
Date
Name
Owned For
Owner Type
Purchase Details
Closed on
Feb 17, 2017
Sold by
Hawker Michael T and Hawker Linda M
Bought by
Michael and Livin Hawker Revocable Livin
Current Estimated Value
Create a Home Valuation Report for This Property
The Home Valuation Report is an in-depth analysis detailing your home's value as well as a comparison with similar homes in the area
Home Values in the Area
Average Home Value in this Area
Purchase History
| Date | Buyer | Sale Price | Title Company |
|---|---|---|---|
| Michael | -- | None Available |
Source: Public Records
Tax History Compared to Growth
Tax History
| Year | Tax Paid | Tax Assessment Tax Assessment Total Assessment is a certain percentage of the fair market value that is determined by local assessors to be the total taxable value of land and additions on the property. | Land | Improvement |
|---|---|---|---|---|
| 2024 | $1,863 | $36,911 | $5,511 | $31,400 |
| 2022 | $1,863 | $29,912 | $4,466 | $25,446 |
| 2021 | $1,692 | $28,169 | $4,206 | $23,963 |
| 2020 | $1,656 | $27,654 | $4,129 | $23,525 |
| 2019 | $1,646 | $27,654 | $4,129 | $23,525 |
| 2018 | $1,645 | $27,654 | $4,129 | $23,525 |
| 2017 | $1,655 | $27,654 | $4,129 | $23,525 |
| 2016 | $1,578 | $27,152 | $4,054 | $23,098 |
| 2015 | $1,989 | $26,287 | $3,925 | $22,362 |
| 2014 | $1,773 | $25,556 | $3,816 | $21,740 |
| 2013 | -- | $25,306 | $3,779 | $21,527 |
Source: Public Records
Map
Nearby Homes
- 2988 N 400 Rd E
- 180 N 400 East Rd
- 1517 W Lake Ct
- 46 N Lake Dr
- Lot 46 E Lake Ct
- 5 Sunnyside Estates
- 7 Sunnyside Estates
- 610 SE Vine St
- 307 N Vine St
- 2322 2000th St
- 106 W Boundary St
- 8428 N Shirlane St
- 305 W Boundary St
- 407 W Boundary St
- 405 W Carter St
- 18 Lincoln St
- 103 Wildflower Point
- 506 Prairie Meadows Dr
- 500 Prairie Meadows Dr
- 608 Prairie Meadows Dr
- 212 W Charles St
- 305 W North St
- 312 N Moore St
- 208 W Charles St
- 313 W Charles St
- 209 W North St
- 317 W Charles St
- 308 N West St
- 200 W Charles St
- 200 W Charles St
- 200 W Charles St
- 308 W Spencer St
- 200 N Moore St
- 309 N Blatchford St
- 201 W Charles St
- 302 W North St
- 312 W Spencer St
- 400 W Charles St
- 313 N Blatchford St
- 401 W Charles St