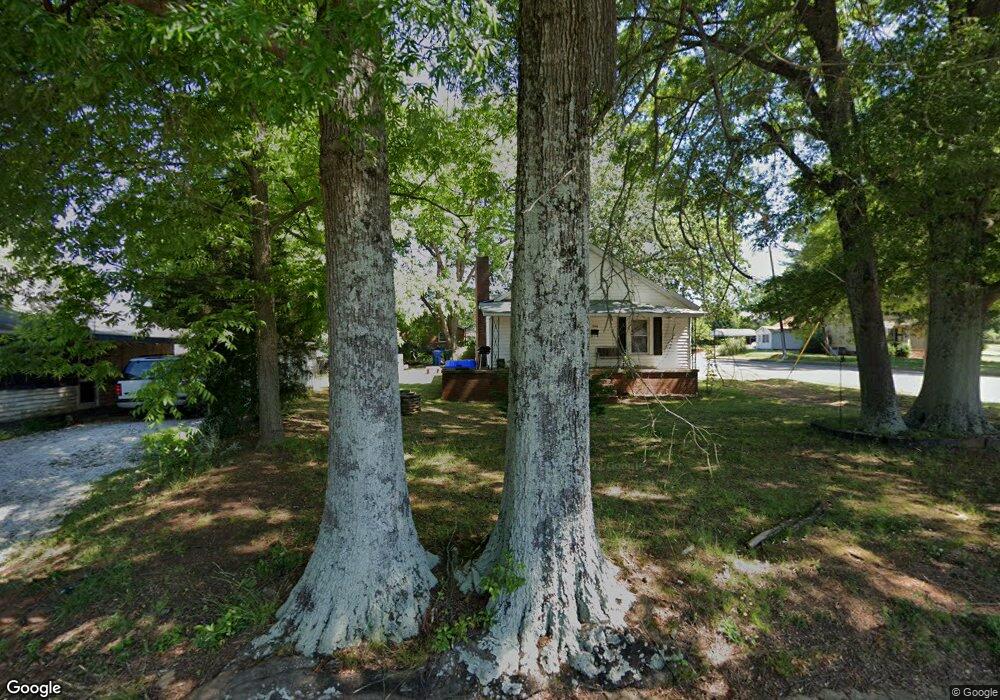
300 Walker St Kings Mountain, NC 28086
Estimated Value: $135,000 - $373,000
--
Bed
--
Bath
1,028
Sq Ft
$302/Sq Ft
Est. Value
About This Home
This home is located at 300 Walker St, Kings Mountain, NC 28086 and is currently estimated at $310,332, approximately $301 per square foot. 300 Walker St is a home located in Cleveland County with nearby schools including North Elementary School, Kings Mountain Middle, and Kings Mountain Intermediate School.
Ownership History
Date
Name
Owned For
Owner Type
Purchase Details
Closed on
Jun 23, 2025
Sold by
Zamora Hernandez Jesus
Bought by
Ramos Elvin Omar Gongora and Dominguez Marihany Lincey
Current Estimated Value
Home Financials for this Owner
Home Financials are based on the most recent Mortgage that was taken out on this home.
Original Mortgage
$370,000
Outstanding Balance
$368,730
Interest Rate
6.81%
Mortgage Type
Seller Take Back
Estimated Equity
-$58,398
Purchase Details
Closed on
Aug 20, 2024
Sold by
Substitute Trustee Services Inc
Bought by
Delta Estates Llc
Purchase Details
Closed on
Aug 15, 2024
Sold by
Delta Estates Llc
Bought by
Investcar Llc
Purchase Details
Closed on
Aug 14, 2024
Sold by
Investcar Llc
Bought by
Zamora Hernandez Jesus
Create a Home Valuation Report for This Property
The Home Valuation Report is an in-depth analysis detailing your home's value as well as a comparison with similar homes in the area
Home Values in the Area
Average Home Value in this Area
Purchase History
| Date | Buyer | Sale Price | Title Company |
|---|---|---|---|
| Ramos Elvin Omar Gongora | $370,000 | None Listed On Document | |
| Delta Estates Llc | $40,411 | None Listed On Document | |
| Investcar Llc | $74,000 | None Listed On Document | |
| Zamora Hernandez Jesus | $81,000 | None Listed On Document |
Source: Public Records
Mortgage History
| Date | Status | Borrower | Loan Amount |
|---|---|---|---|
| Open | Ramos Elvin Omar Gongora | $370,000 |
Source: Public Records
Tax History Compared to Growth
Tax History
| Year | Tax Paid | Tax Assessment Tax Assessment Total Assessment is a certain percentage of the fair market value that is determined by local assessors to be the total taxable value of land and additions on the property. | Land | Improvement |
|---|---|---|---|---|
| 2025 | $901 | $87,943 | $18,900 | $69,043 |
| 2024 | $409 | $32,899 | $9,324 | $23,575 |
| 2023 | $393 | $32,899 | $9,324 | $23,575 |
| 2022 | $391 | $32,899 | $9,324 | $23,575 |
| 2021 | $393 | $32,899 | $9,324 | $23,575 |
| 2020 | $377 | $30,868 | $9,324 | $21,544 |
| 2019 | $377 | $30,868 | $9,324 | $21,544 |
| 2018 | $371 | $30,868 | $9,324 | $21,544 |
| 2017 | $372 | $30,868 | $9,324 | $21,544 |
| 2016 | $374 | $30,868 | $9,324 | $21,544 |
| 2015 | $392 | $33,331 | $7,875 | $25,456 |
| 2014 | $392 | $33,331 | $7,875 | $25,456 |
Source: Public Records
Map
Nearby Homes
- 300 Fulton St
- 312 Fulton St
- 116 Walker St
- 207 Morris St
- 109 Fulton St Unit 9
- 310 Campbell Cir
- 200 Lackey St Unit 1-2
- 300 N Watterson St
- 5066 Beargrass Dr
- 905 Gantt St
- 405 Clinton Dr
- 522 Waco Rd
- 524 Waco Rd
- 106 N Tracy St
- 308 N Carpenter St
- 1003 Ramseur St
- 403 Cherry St
- 110 N Gaston St
- 408 Walnut St
- 409 Chestnut St
- 607 N Cansler St
- 302 Walker St
- 605 N Cansler St
- 603 Alexander St
- 301 Walker St
- 304 Walker St
- 609 N Cansler St
- 224 Walker St
- 227 Walker St
- 305 Walker St
- 605 Alexander St
- 222 Walker St
- 608 Temple St Unit L11
- 613 N Cansler St
- 508 N Cansler St
- 307 Walker St
- 600 Temple St
- 602 Temple St
- 505 N Cansler St
- 612 Temple St