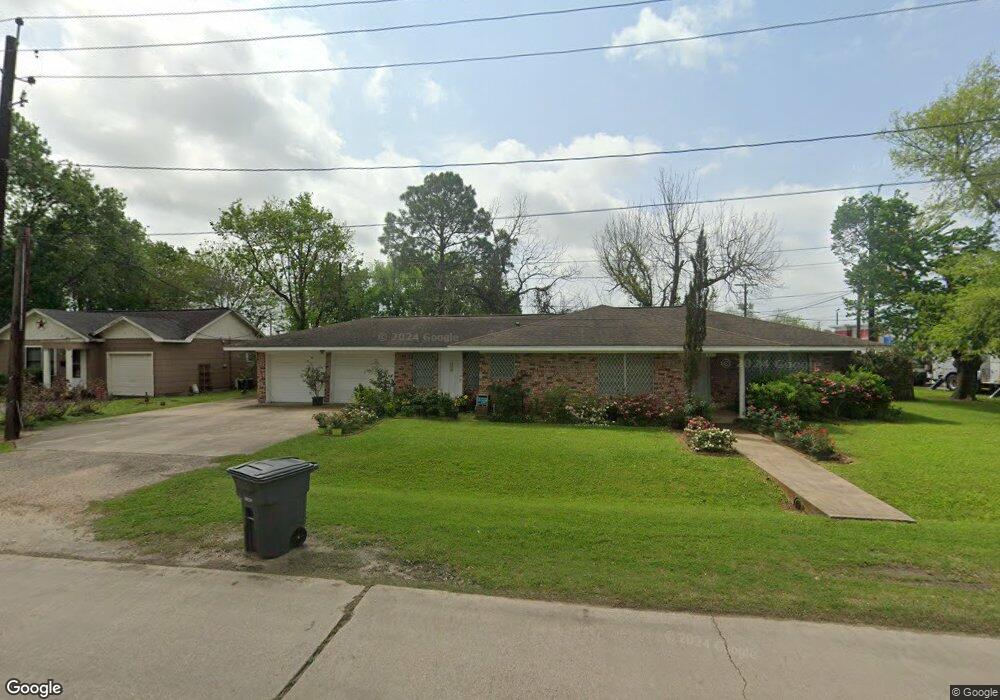
3000 8th St Bay City, TX 77414
Estimated Value: $193,641 - $272,000
3
Beds
2
Baths
1,766
Sq Ft
$127/Sq Ft
Est. Value
About This Home
This home is located at 3000 8th St, Bay City, TX 77414 and is currently estimated at $225,160, approximately $127 per square foot. 3000 8th St is a home located in Matagorda County with nearby schools including John H. Cherry Elementary School, Bay City Junior High School, and Bay City High School.
Ownership History
Date
Name
Owned For
Owner Type
Purchase Details
Closed on
Apr 30, 2025
Sold by
B2ake Llc
Bought by
Salazar Ernesto Rubio
Current Estimated Value
Purchase Details
Closed on
Apr 24, 2014
Sold by
Ortiz David and Ortiz Rosaura Y
Bought by
Ortiz Jose D and Ortiz Silvia
Home Financials for this Owner
Home Financials are based on the most recent Mortgage that was taken out on this home.
Original Mortgage
$67,373
Interest Rate
4.43%
Mortgage Type
Purchase Money Mortgage
Purchase Details
Closed on
Jun 24, 2009
Sold by
Ortiz Silvia and Ortiz David J
Bought by
Baltazar Martha Elva and Baltazar Guadalupe
Purchase Details
Closed on
Oct 30, 2006
Sold by
Spurr Roland
Bought by
Day Willie R
Home Financials for this Owner
Home Financials are based on the most recent Mortgage that was taken out on this home.
Original Mortgage
$95,247
Interest Rate
6.41%
Mortgage Type
Purchase Money Mortgage
Create a Home Valuation Report for This Property
The Home Valuation Report is an in-depth analysis detailing your home's value as well as a comparison with similar homes in the area
Home Values in the Area
Average Home Value in this Area
Purchase History
| Date | Buyer | Sale Price | Title Company |
|---|---|---|---|
| Salazar Ernesto Rubio | -- | None Listed On Document | |
| Ortiz Jose D | -- | Admiral Title Llc | |
| Baltazar Martha Elva | $25,000 | None Available | |
| Day Willie R | -- | -- |
Source: Public Records
Mortgage History
| Date | Status | Borrower | Loan Amount |
|---|---|---|---|
| Previous Owner | Ortiz Jose D | $67,373 | |
| Previous Owner | Day Willie R | $95,247 |
Source: Public Records
Tax History Compared to Growth
Tax History
| Year | Tax Paid | Tax Assessment Tax Assessment Total Assessment is a certain percentage of the fair market value that is determined by local assessors to be the total taxable value of land and additions on the property. | Land | Improvement |
|---|---|---|---|---|
| 2024 | $39 | $217,940 | $22,580 | $195,360 |
| 2023 | $3,538 | $204,020 | $22,580 | $181,440 |
| 2022 | $3,686 | $138,020 | $16,150 | $121,870 |
| 2021 | $3,890 | $160,160 | $16,150 | $144,010 |
| 2020 | $3,679 | $120,380 | $16,150 | $104,230 |
| 2019 | $3,706 | $121,320 | $16,150 | $105,170 |
| 2018 | $3,671 | $124,610 | $16,150 | $108,460 |
| 2017 | $3,525 | $126,250 | $16,150 | $110,100 |
| 2016 | $3,406 | $122,010 | $16,150 | $105,860 |
| 2015 | -- | $128,340 | $16,150 | $112,190 |
| 2014 | -- | $104,640 | $16,150 | $88,490 |
Source: Public Records
Map
Nearby Homes