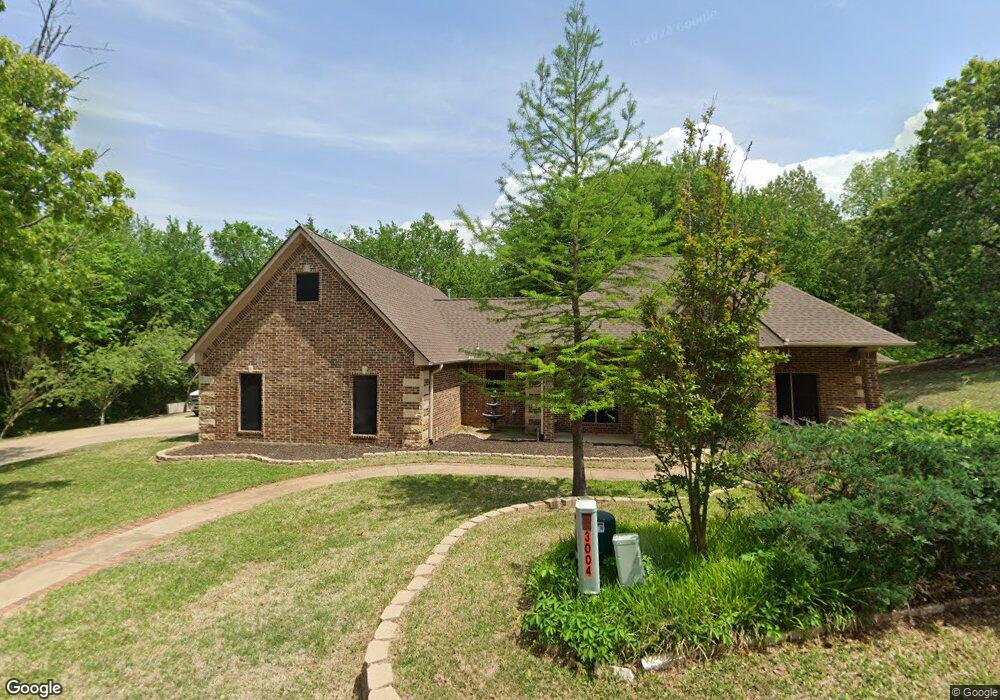
3000 Belle Ave Denison, TX 75020
Estimated Value: $381,686 - $480,000
3
Beds
2
Baths
2,409
Sq Ft
$179/Sq Ft
Est. Value
About This Home
This home is located at 3000 Belle Ave, Denison, TX 75020 and is currently estimated at $430,843, approximately $178 per square foot. 3000 Belle Ave is a home located in Grayson County with nearby schools including Hyde Park Elementary School, Scott Middle School, and Denison High School.
Ownership History
Date
Name
Owned For
Owner Type
Purchase Details
Closed on
Apr 28, 2015
Sold by
Parks Jason R and Parks Kimberly D
Bought by
Deweber Steven and Deweber Alyson
Current Estimated Value
Home Financials for this Owner
Home Financials are based on the most recent Mortgage that was taken out on this home.
Original Mortgage
$216,015
Outstanding Balance
$167,669
Interest Rate
3.89%
Mortgage Type
FHA
Estimated Equity
$263,174
Purchase Details
Closed on
Sep 10, 2008
Sold by
Miller Aaron W and Miller Tiffany M
Bought by
Parks Jason R and Parks Kimberly D
Home Financials for this Owner
Home Financials are based on the most recent Mortgage that was taken out on this home.
Original Mortgage
$14,400
Interest Rate
6.54%
Mortgage Type
Purchase Money Mortgage
Purchase Details
Closed on
Feb 16, 2006
Sold by
Denison Group I Inc
Bought by
Miller Aaron W and Miller Tiffany M
Create a Home Valuation Report for This Property
The Home Valuation Report is an in-depth analysis detailing your home's value as well as a comparison with similar homes in the area
Home Values in the Area
Average Home Value in this Area
Purchase History
| Date | Buyer | Sale Price | Title Company |
|---|---|---|---|
| Deweber Steven | -- | Grayson County Title | |
| Parks Jason R | -- | Grayson County Title | |
| Miller Aaron W | -- | None Available |
Source: Public Records
Mortgage History
| Date | Status | Borrower | Loan Amount |
|---|---|---|---|
| Open | Deweber Steven | $216,015 | |
| Previous Owner | Parks Jason R | $14,400 |
Source: Public Records
Tax History
| Year | Tax Paid | Tax Assessment Tax Assessment Total Assessment is a certain percentage of the fair market value that is determined by local assessors to be the total taxable value of land and additions on the property. | Land | Improvement |
|---|---|---|---|---|
| 2025 | $7,556 | $424,332 | -- | -- |
| 2024 | $8,962 | $385,756 | $0 | $0 |
| 2023 | $6,539 | $350,687 | $0 | $0 |
| 2022 | $7,575 | $318,806 | $0 | $0 |
| 2021 | $7,310 | $289,824 | $39,015 | $250,809 |
| 2020 | $7,507 | $284,591 | $25,857 | $258,734 |
| 2019 | $7,585 | $275,639 | $25,857 | $249,782 |
| 2018 | $7,020 | $256,980 | $15,912 | $241,068 |
| 2017 | $6,436 | $230,060 | $15,912 | $214,148 |
| 2016 | $6,023 | $215,278 | $15,912 | $199,366 |
| 2015 | $5,079 | $200,018 | $15,912 | $184,106 |
| 2014 | $5,206 | $199,184 | $15,912 | $183,272 |
Source: Public Records
Map
Nearby Homes
- 3013 Belle Ave
- 1803 Woodland Park Dr
- 2100 Deer Run
- 1800 Park Ave
- 1838 Park Ave
- 2131 Deer Run
- 2111 Renaissance Dr
- 0000 TBD Theresa Dr
- 2108 Turtlecreek
- 527 W Coffin St
- 1130 Amsden Cir
- 2601 Arapaho Cir
- 3312 Vine Ln
- 1901 Woodlawn Blvd
- 2206 Bluebonnet Ave
- 1020 Rice St
- 2016 Bluebonnet Ave
- 1830 Clark Dr
- 0 S Maurice Ave
- 2606 Easy St
- 3004 Belle Ave
- 3012 Belle Ave
- 3005 Belle Ave
- 3001 Belle Ave
- 3011 Belle Ave
- 3014 Belle Ave
- 3000 Frances Dr
- 3015 Belle Ave
- 3018 Frances Dr
- TBD Belle Ave
- 3021 Belle Ave
- 3026 Belle Ave
- 3026 Frances Dr
- 3005 Frances Dr
- 3009 Frances Dr
- 3025 Belle Ave
- 3011 Frances Dr
- 3001 Frances Dr
- 3028 Frances Dr
- 3015 Frances Dr