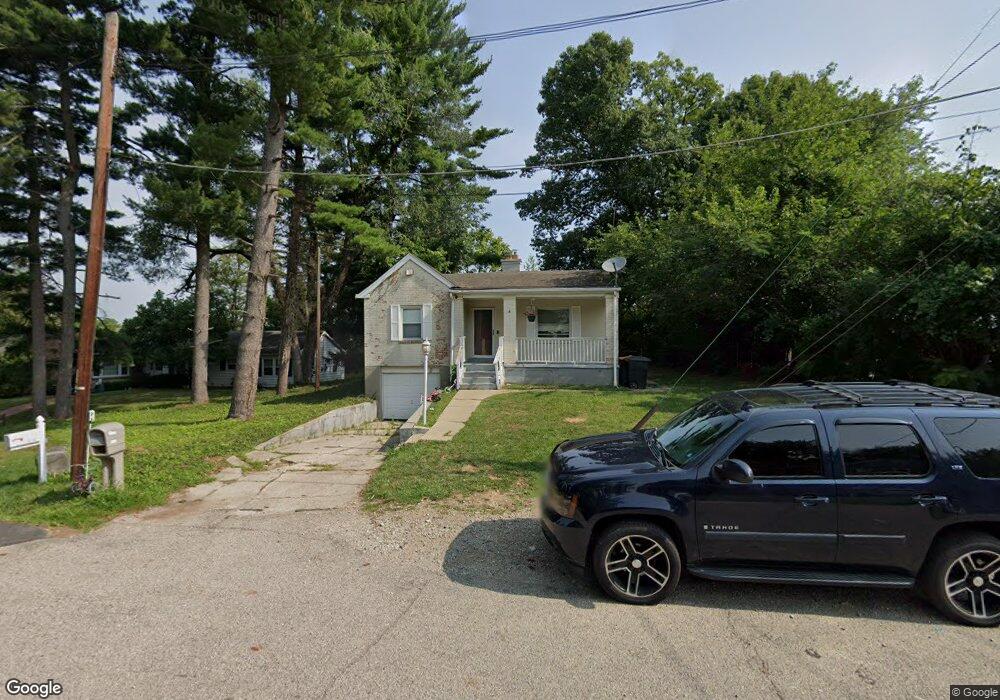
3000 Earl Rd Cincinnati, OH 45239
Estimated Value: $131,000 - $185,000
2
Beds
1
Bath
886
Sq Ft
$167/Sq Ft
Est. Value
About This Home
This home is located at 3000 Earl Rd, Cincinnati, OH 45239 and is currently estimated at $147,927, approximately $166 per square foot. 3000 Earl Rd is a home located in Hamilton County with nearby schools including White Oak Middle School, Colerain High School, and Cincinnati Achievement Academy.
Ownership History
Date
Name
Owned For
Owner Type
Purchase Details
Closed on
Sep 8, 2022
Sold by
Luchsinger Brittany A
Bought by
Lopez Mauricio
Current Estimated Value
Purchase Details
Closed on
Jun 29, 2007
Sold by
Ostendorf Matt
Bought by
Maumeier Brittany A
Home Financials for this Owner
Home Financials are based on the most recent Mortgage that was taken out on this home.
Original Mortgage
$94,000
Interest Rate
6.71%
Mortgage Type
Unknown
Purchase Details
Closed on
Feb 27, 2007
Sold by
Fannie Mae
Bought by
Ostendorf Matt
Purchase Details
Closed on
Sep 25, 2006
Sold by
Traynor Judy Walsh
Bought by
Fannie Mae and Federal National Mortgage Association
Purchase Details
Closed on
Dec 26, 2002
Sold by
Walsh Traynor Judy and Walsh Katherine
Bought by
Traynor Judy Walsh
Create a Home Valuation Report for This Property
The Home Valuation Report is an in-depth analysis detailing your home's value as well as a comparison with similar homes in the area
Home Values in the Area
Average Home Value in this Area
Purchase History
| Date | Buyer | Sale Price | Title Company |
|---|---|---|---|
| Lopez Mauricio | $100,000 | -- | |
| Maumeier Brittany A | $94,000 | Heritage Title Llc | |
| Ostendorf Matt | $35,000 | None Available | |
| Fannie Mae | $46,000 | None Available | |
| Traynor Judy Walsh | -- | -- |
Source: Public Records
Mortgage History
| Date | Status | Borrower | Loan Amount |
|---|---|---|---|
| Previous Owner | Maumeier Brittany A | $94,000 |
Source: Public Records
Tax History
| Year | Tax Paid | Tax Assessment Tax Assessment Total Assessment is a certain percentage of the fair market value that is determined by local assessors to be the total taxable value of land and additions on the property. | Land | Improvement |
|---|---|---|---|---|
| 2025 | $2,017 | $35,001 | $9,244 | $25,757 |
| 2024 | $1,870 | $35,001 | $9,244 | $25,757 |
| 2023 | $1,881 | $35,001 | $9,244 | $25,757 |
| 2022 | $1,276 | $19,327 | $7,231 | $12,096 |
| 2021 | $1,265 | $19,327 | $7,231 | $12,096 |
| 2020 | $1,278 | $19,327 | $7,231 | $12,096 |
| 2019 | $1,161 | $16,381 | $6,129 | $10,252 |
| 2018 | $1,041 | $16,381 | $6,129 | $10,252 |
| 2017 | $987 | $16,381 | $6,129 | $10,252 |
| 2016 | $1,209 | $19,828 | $8,421 | $11,407 |
| 2015 | $1,220 | $19,828 | $8,421 | $11,407 |
| 2014 | $1,222 | $19,828 | $8,421 | $11,407 |
| 2013 | $1,264 | $21,550 | $9,153 | $12,397 |
Source: Public Records
Map
Nearby Homes
- 2801 Byrneside Dr
- 2806 Breezy Way
- 2820 Geraldine Dr
- 3191 Preserve Ln
- 3181 Preserve Ln
- 3181 Preserve Ln Unit 1C
- 2730 Byrneside Dr
- 5970 Colerain Ave
- 2937 Blue Rock Rd
- 3217 Rockacres Ct
- 3260 Blueacres Dr
- 6751 Rutherford Ct
- 3250 March Terrace
- 3140 Banning Rd
- 2836 Banning Rd
- 2757 Banning Rd
- 3236 Deborah Ln
- 6278 Seiler Dr
- 2603 Kipling Ave
- 2503 Flanigan Ct
- 3010 Earl Rd
- 3010 Earl Rd
- 2999 Earl Rd
- 2999 Earl Rd
- 2995 Earl Rd
- 2989 Earl Rd
- 2979 Earl Rd
- 2979 Earl Rd
- 2947 Earl Rd
- 2947 Earl Rd
- 2950 Loretta Dr
- 2950 Loretta Dr
- 6259 Colerain Ave
- 2930 Loretta Dr
- 2918 Loretta Dr
- 6225 Colerain Ave
- 6225 Colerain Ave Unit 6259
- 2910 Loretta Dr
- 2900 Loretta Dr
- 6300 Colerain Ave
Your Personal Tour Guide
Ask me questions while you tour the home.