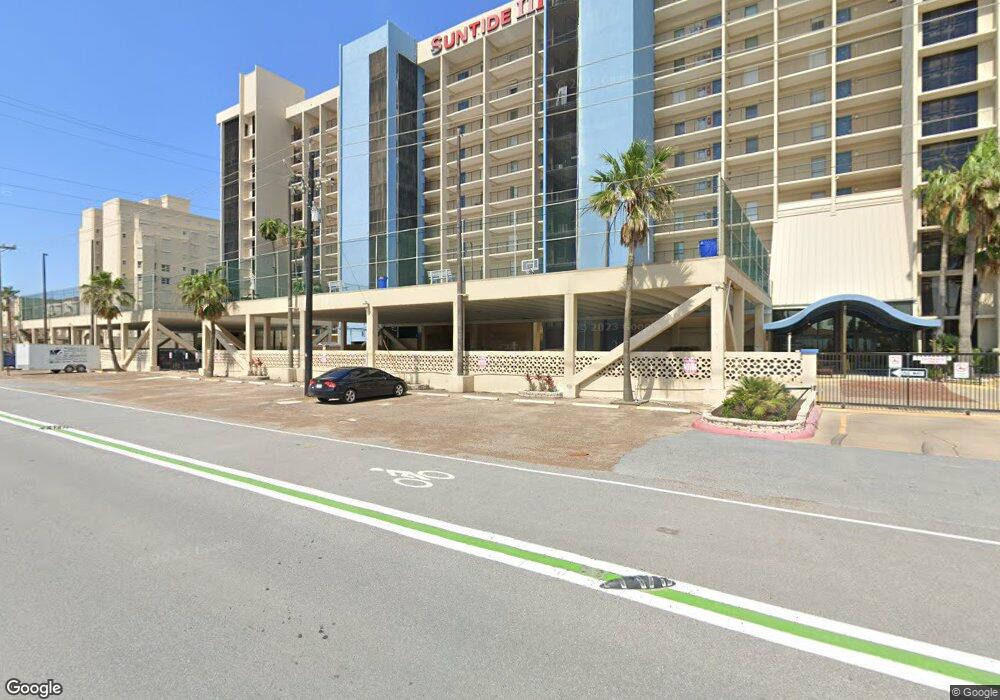
Suntide III 3000 Gulf Blvd Unit 1101 South Padre Island, TX 78597
Estimated Value: $722,642 - $837,000
--
Bed
--
Bath
1,789
Sq Ft
$440/Sq Ft
Est. Value
About This Home
This home is located at 3000 Gulf Blvd Unit 1101, South Padre Island, TX 78597 and is currently estimated at $786,911, approximately $439 per square foot. 3000 Gulf Blvd Unit 1101 is a home located in Cameron County with nearby schools including Garriga Elementary School, Derry Elementary School, and Port Isabel Junior High School.
Ownership History
Date
Name
Owned For
Owner Type
Purchase Details
Closed on
Jun 16, 2020
Sold by
Reilly Jr Henry Charles O
Bought by
Reilly Jr Henry Charles O and The Charlie O Reilly Living Trust
Current Estimated Value
Purchase Details
Closed on
Oct 12, 2007
Sold by
Oreilly Henry Charles
Bought by
Oreilly Henry Charles and Oreilly Family Trust A
Purchase Details
Closed on
Nov 13, 2003
Sold by
Oreilly Henry Charles and Oreilly Helen Ann
Bought by
Oreilly Henry Charles
Purchase Details
Closed on
Apr 5, 1999
Sold by
Beller Carl A and Beller Carol T
Bought by
Oreilly Henry Charles and Oreilly Helen Ann
Home Financials for this Owner
Home Financials are based on the most recent Mortgage that was taken out on this home.
Original Mortgage
$240,000
Interest Rate
6.89%
Create a Home Valuation Report for This Property
The Home Valuation Report is an in-depth analysis detailing your home's value as well as a comparison with similar homes in the area
Home Values in the Area
Average Home Value in this Area
Purchase History
| Date | Buyer | Sale Price | Title Company |
|---|---|---|---|
| Reilly Jr Henry Charles O | -- | None Available | |
| Oreilly Henry Charles | -- | None Available | |
| Oreilly Henry Charles | -- | -- | |
| Oreilly Henry Charles | -- | -- |
Source: Public Records
Mortgage History
| Date | Status | Borrower | Loan Amount |
|---|---|---|---|
| Closed | Oreilly Henry Charles | $240,000 |
Source: Public Records
Tax History Compared to Growth
Tax History
| Year | Tax Paid | Tax Assessment Tax Assessment Total Assessment is a certain percentage of the fair market value that is determined by local assessors to be the total taxable value of land and additions on the property. | Land | Improvement |
|---|---|---|---|---|
| 2025 | $12,315 | $745,000 | $60,157 | $684,843 |
| 2024 | $12,315 | $754,237 | $60,157 | $694,080 |
| 2023 | $14,181 | $827,153 | $60,157 | $766,996 |
| 2022 | $10,678 | $563,535 | $60,157 | $503,378 |
| 2021 | $8,971 | $446,065 | $60,157 | $385,908 |
| 2020 | $9,140 | $451,391 | $60,157 | $391,234 |
| 2019 | $9,570 | $463,474 | $60,157 | $403,317 |
| 2018 | $9,676 | $468,894 | $60,157 | $408,737 |
| 2017 | $9,822 | $479,739 | $60,157 | $419,582 |
| 2016 | $9,933 | $485,159 | $60,157 | $425,002 |
| 2015 | $9,901 | $490,580 | $60,157 | $430,423 |
Source: Public Records
About Suntide III
Map
Nearby Homes
- 3000 Gulf Blvd
- 3000 Gulf Blvd Unit 701
- 3000 Gulf Blvd Unit 1002
- 3000 Gulf Blvd Unit 1003
- 3000 Gulf Blvd Unit 706
- 3000 Gulf Blvd Unit 402
- 3000 Gulf Blvd Unit 508
- 3000 Gulf Blvd Unit 401
- 3000 Gulf Blvd Unit 302
- 3101 Gulf Blvd Unit B47BldgB2
- 107 E Kingfish St Unit 5
- 103 E Kingfish St Unit 3
- 105 E Kingfish St Unit 4
- 129 E Kingfish
- 126 E Red Snapper St
- 131 E Acapulco St
- 116A & 116B E Dolphin St
- 2700 Gulf Blvd Unit 104
- 2700 Gulf Blvd Unit 501
- 114 E Red Snapper St Unit A
- 3000 Gulf Blvd Unit 301
- 3000 Gulf Blvd Unit 1210
- 3000 Gulf Blvd Unit 1209
- 3000 Gulf Blvd Unit 1207
- 3000 Gulf Blvd Unit 1206
- 3000 Gulf Blvd Unit 1205
- 3000 Gulf Blvd Unit 1204
- 3000 Gulf Blvd Unit 1203
- 3000 Gulf Blvd Unit 1202
- 3000 Gulf Blvd Unit 1201
- 3000 Gulf Blvd Unit 1110
- 3000 Gulf Blvd Unit 1109
- 3000 Gulf Blvd Unit 1108
- 3000 Gulf Blvd Unit 1107
- 3000 Gulf Blvd Unit 1106
- 3000 Gulf Blvd Unit 1105
- 3000 Gulf Blvd Unit 1104
- 3000 Gulf Blvd Unit 1103
- 3000 Gulf Blvd Unit 1102
- 3000 Gulf Blvd Unit 1010