3000 Lakeview Acres Rd Conway, AR 72032
Estimated Value: $429,000 - $476,000
About This Home
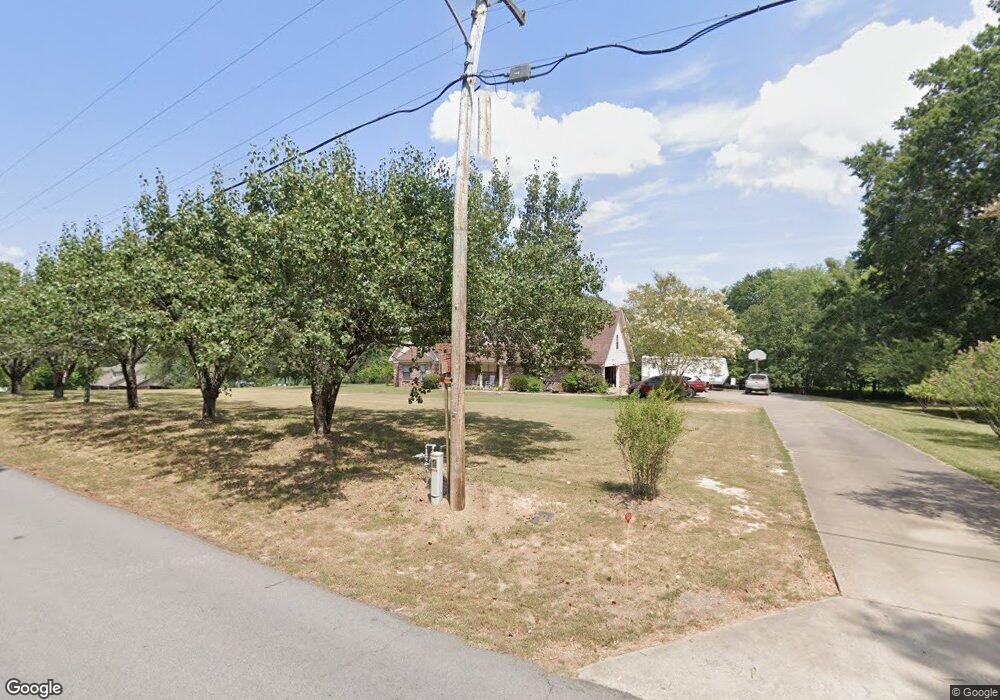
This home is located at 3000 Lakeview Acres Rd, Conway, AR 72032 and is currently estimated at $447,908, approximately $122 per square foot. 3000 Lakeview Acres Rd is a home located in Faulkner County with nearby schools including Theodore Jones Elementary School, Conway Junior High School, and Conway High School.
Ownership History
We collect this data history from publicly available records. To have your information removed, we recommend requesting removal directly through your county’s website.
Purchase Details
Home Financials for this Owner
Home Financials are based on the most recent Mortgage that was taken out on this home.Purchase Details
Home Financials for this Owner
Home Financials are based on the most recent Mortgage that was taken out on this home.Purchase Details
Home Financials for this Owner
Home Financials are based on the most recent Mortgage that was taken out on this home.Home Values in the Area
Average Home Value in this Area
Purchase History
We collect this data history from publicly available records. To have your information removed, we recommend requesting removal directly through your county’s website.
| Date | Buyer | Sale Price | Title Company |
|---|---|---|---|
| $201,000 | -- | ||
| $133,333 | Lenders Title Co | ||
| $234,000 | -- | ||
| $234,000 | None Available | ||
| $234,000 | -- |
Mortgage History
We collect this data history from publicly available records. To have your information removed, we recommend requesting removal directly through your county’s website.
| Date | Status | Borrower | Loan Amount |
|---|---|---|---|
| Open | $183,241 | ||
| Previous Owner | $46,800 | ||
| Previous Owner | $187,200 | ||
| Previous Owner | $187,200 |
Tax History
We collect this data history from publicly available records. To have your information removed, we recommend requesting removal directly through your county’s website.
| Year | Tax Paid | Tax Assessment Tax Assessment Total Assessment is a certain percentage of the fair market value that is determined by local assessors to be the total taxable value of land and additions on the property. | Land | Improvement |
|---|---|---|---|---|
| 2025 | $3,344 | $82,930 | $9,220 | $73,710 |
| 2024 | $3,192 | $82,930 | $9,220 | $73,710 |
| 2023 | $3,040 | $60,080 | $9,220 | $50,860 |
| 2022 | $2,600 | $60,080 | $9,220 | $50,860 |
| 2021 | $2,465 | $60,080 | $9,220 | $50,860 |
| 2020 | $2,330 | $53,460 | $9,220 | $44,240 |
| 2019 | $2,330 | $53,460 | $9,220 | $44,240 |
| 2018 | $2,355 | $53,460 | $9,220 | $44,240 |
| 2017 | $2,355 | $53,460 | $9,220 | $44,240 |
| 2016 | $2,355 | $53,460 | $9,220 | $44,240 |
| 2015 | $2,705 | $53,460 | $9,220 | $44,240 |
| 2014 | $2,355 | $54,820 | $9,220 | $45,600 |
Map
- 00 Cadron Gap Rd
- 800 Grandview Heights
- 3290 Marlsgate Dr
- 1501 Dogwood Trail
- 250 E Grandview Heights Dr
- 1320 Sawyer Ln
- 1400 Sawyer Ln
- 200 Waterview Dr
- 1500 Sawyer Ln
- Tract 4 Friendship Rd
- Tract 2 Friendship Rd
- Tract 1 Friendship Rd
- 1204 Harton St
- 1800 Altus St
- 2450 Village Court Dr
- 845 Steel Ave
- 1610 Jones Dr
- 1050 Gallery Dr
- 2013 Creekwood Dr
- 2925 Gladstone Dr
- 3020 Lakeview Acres Rd
- 3020 Lakeview Acres Rd
- 3001 Lakeview Acres Rd
- 2920 Lakeview Acres Rd
- 905 Wakefield Dr
- 3040 Lakeview Acres Rd
- 915 Wakefield Dr
- 910 Wakefield Dr
- 2921 Lakeview Acres Rd
- 0 Lakeview Acres Rd Unit 16017624
- 3060 Westover Dr
- 3050 Westover Dr
- 8 acres Lakeview Dr
- 920 Wakefield Dr
- 3040 Westover Dr
- 910 Cadron Gap Rd
- 925 Wakefield Dr
- 3030 Westover Dr
- 935 Cadron Gap Rd
- 930 Wakefield Dr
Ask me questions while you tour the home.