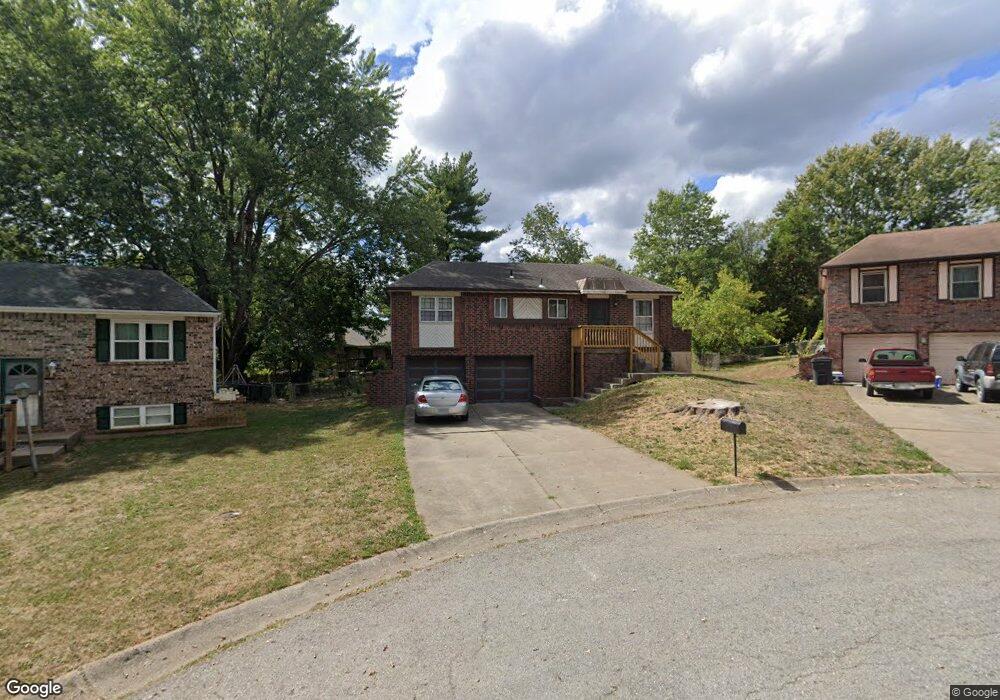
3000 NW Milford Place Blue Springs, MO 64015
Estimated Value: $218,000 - $245,000
3
Beds
2
Baths
1,040
Sq Ft
$222/Sq Ft
Est. Value
About This Home
This home is located at 3000 NW Milford Place, Blue Springs, MO 64015 and is currently estimated at $230,466, approximately $221 per square foot. 3000 NW Milford Place is a home located in Jackson County with nearby schools including James Lewis Elementary School, Brittany Hill Middle School, and Blue Springs High School.
Ownership History
Date
Name
Owned For
Owner Type
Purchase Details
Closed on
Oct 29, 2021
Sold by
Hoobler Brent L
Bought by
Hoobler Brent L
Current Estimated Value
Purchase Details
Closed on
Jul 21, 2005
Sold by
Hoobler Marion F
Bought by
Hoobler Marion F and The Marion F Hoobler Trust
Create a Home Valuation Report for This Property
The Home Valuation Report is an in-depth analysis detailing your home's value as well as a comparison with similar homes in the area
Home Values in the Area
Average Home Value in this Area
Purchase History
| Date | Buyer | Sale Price | Title Company |
|---|---|---|---|
| Hoobler Brent L | -- | None Listed On Document | |
| Hoobler Marion F | -- | -- |
Source: Public Records
Tax History Compared to Growth
Tax History
| Year | Tax Paid | Tax Assessment Tax Assessment Total Assessment is a certain percentage of the fair market value that is determined by local assessors to be the total taxable value of land and additions on the property. | Land | Improvement |
|---|---|---|---|---|
| 2025 | $2,169 | $30,576 | $6,207 | $24,369 |
| 2024 | $2,128 | $26,589 | $4,186 | $22,403 |
| 2023 | $2,128 | $26,588 | $3,929 | $22,659 |
| 2022 | $2,219 | $24,510 | $3,696 | $20,814 |
| 2021 | $2,217 | $24,510 | $3,696 | $20,814 |
| 2020 | $1,983 | $22,302 | $3,696 | $18,606 |
| 2019 | $1,917 | $22,302 | $3,696 | $18,606 |
| 2018 | $892,153 | $19,410 | $3,217 | $16,193 |
| 2017 | $1,734 | $19,410 | $3,217 | $16,193 |
| 2016 | $1,686 | $18,924 | $3,059 | $15,865 |
| 2014 | $1,724 | $19,289 | $2,780 | $16,509 |
Source: Public Records
Map
Nearby Homes
- 1029 NW Berkshire Dr
- 2916 NW Chelsea Place
- 2804 NW Kingsridge Dr
- 3212 NW Canterbury Rd
- 3213 NW Canterbury Place
- 913 NW Camelot Ct
- 516 NW Mill Ct
- 2508 NW Castle Dr
- 2317 NW Kensington Ct
- 704 NW 39th St
- 3605 NW Dogwood Dr
- 124 SW 27th St
- 3616 NW Dogwood Dr
- 4012 NW Delwood Ct
- 1618 NW Samantha Ct
- 41 Clipper Dr
- 308 SW Woods Chapel Rd
- 216 SW 26th St
- 1389 NW Jefferson Ct
- 4301 NW Briarwood Dr
- 2920 NW Milford Place
- 3013 NW Bristol Ct
- 3004 NW Milford Place
- 3009 NW Bristol Ct
- 2916 NW Milford Place
- 3005 NW Milford Place
- 3005 NW Bristol Ct
- 3017 NW Bristol Ct
- 3001 NW Bristol Ct
- 2917 NW Milford Place
- 3001 NW Milford Place
- 2921 NW Milford Place
- 3021 NW Bristol Ct
- 3008 NW Canterbury Rd
- 2913 NW Milford Place
- 3004 NW Canterbury Rd
- 3012 NW Canterbury Rd
- 2908 NW Milford Place
- 2921 NW Bristol Ct
- 2909 NW Milford Place