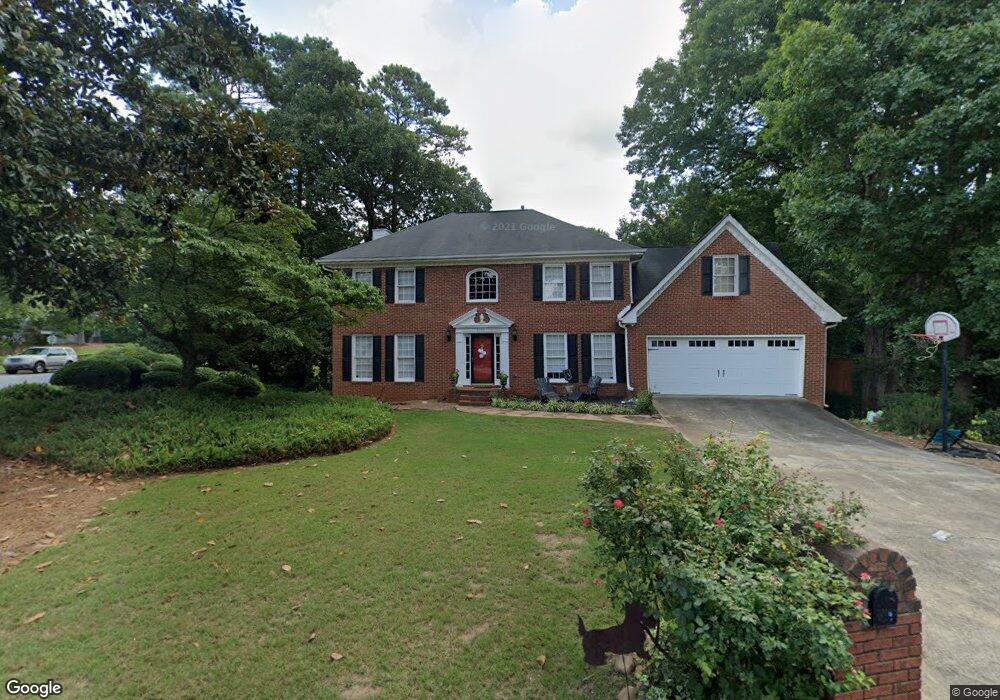
3000 Pillement Place Unit 2 Alpharetta, GA 30022
Newtown NeighborhoodEstimated Value: $620,703 - $673,000
4
Beds
3
Baths
2,592
Sq Ft
$251/Sq Ft
Est. Value
About This Home
This home is located at 3000 Pillement Place Unit 2, Alpharetta, GA 30022 and is currently estimated at $651,426, approximately $251 per square foot. 3000 Pillement Place Unit 2 is a home located in Fulton County with nearby schools including Hillside Elementary School, Haynes Bridge Middle School, and Centennial High School.
Ownership History
Date
Name
Owned For
Owner Type
Purchase Details
Closed on
Aug 25, 1993
Sold by
Lusk Judd S Beverly M
Bought by
Aronica Scott J Beth E
Current Estimated Value
Home Financials for this Owner
Home Financials are based on the most recent Mortgage that was taken out on this home.
Original Mortgage
$149,500
Interest Rate
7.18%
Create a Home Valuation Report for This Property
The Home Valuation Report is an in-depth analysis detailing your home's value as well as a comparison with similar homes in the area
Home Values in the Area
Average Home Value in this Area
Purchase History
| Date | Buyer | Sale Price | Title Company |
|---|---|---|---|
| Aronica Scott J Beth E | $186,900 | -- |
Source: Public Records
Mortgage History
| Date | Status | Borrower | Loan Amount |
|---|---|---|---|
| Closed | Aronica Scott J Beth E | $149,500 |
Source: Public Records
Tax History Compared to Growth
Tax History
| Year | Tax Paid | Tax Assessment Tax Assessment Total Assessment is a certain percentage of the fair market value that is determined by local assessors to be the total taxable value of land and additions on the property. | Land | Improvement |
|---|---|---|---|---|
| 2025 | $5,749 | $180,080 | $58,320 | $121,760 |
| 2023 | $5,406 | $191,520 | $46,680 | $144,840 |
| 2022 | $5,292 | $172,440 | $39,480 | $132,960 |
| 2021 | $5,114 | $162,320 | $29,280 | $133,040 |
| 2020 | $4,707 | $146,240 | $33,040 | $113,200 |
| 2019 | $588 | $149,040 | $32,000 | $117,040 |
| 2018 | $4,445 | $136,480 | $50,360 | $86,120 |
| 2017 | $4,029 | $118,360 | $44,200 | $74,160 |
| 2016 | $3,970 | $118,360 | $44,200 | $74,160 |
| 2015 | $4,014 | $118,360 | $44,200 | $74,160 |
| 2014 | $3,927 | $111,360 | $24,880 | $86,480 |
Source: Public Records
Map
Nearby Homes
- 280 Vidaulan Ct
- 835 Kings Arms Way
- 140 Old Sandhurst Landing
- 9320 Brumbelow Crossing Way
- 125 Georgian Manor Ct
- 2935 Georgian Manor Dr
- 710 Leeds Garden Terrace
- 160 Arden Place
- 440 Guildhall Grove Unit 2
- 2910 Leeds Garden Ln
- 2765 Chandon Place
- 150 Stoney Ridge Dr
- 215 Ridge Point Ct
- 9165 Nesbit Ferry Rd Unit 9
- 9024 Tuckerbrook Ln
- 3535 Merganser Ln Unit 2
- 51 Nesbit Place
- 3095 Arborwoods Dr
- 3010 Pillement Place
- 3065 Arborwoods Dr
- 3103 Arborwoods Dr Unit 3
- 3070 Arborwoods Dr
- 3020 Pillement Place
- 3060 Arborwoods Dr
- 3015 Pillement Place
- 3111 Arborwoods Dr
- 3090 Arborwoods Dr
- 0 Arborwoods Dr Unit 8975178
- 0 Arborwoods Dr Unit 7522798
- 0 Arborwoods Dr Unit 7522446
- 0 Arborwoods Dr Unit 7496691
- 0 Arborwoods Dr Unit 7458760
- 0 Arborwoods Dr Unit 7433012
- 0 Arborwoods Dr Unit 7392035
- 0 Arborwoods Dr Unit 7334741
- 0 Arborwoods Dr Unit 7322772
- 0 Arborwoods Dr Unit 7271183