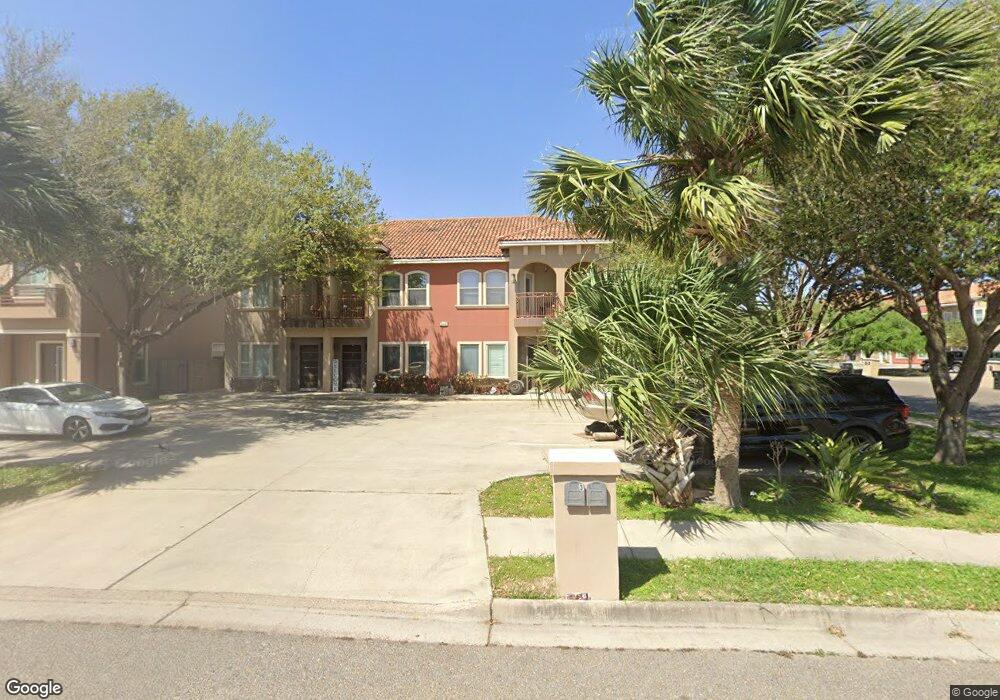
3000 S L Ln Unit 4 McAllen, TX 78503
Estimated Value: $134,000 - $163,754
2
Beds
2
Baths
1,312
Sq Ft
$117/Sq Ft
Est. Value
About This Home
This home is located at 3000 S L Ln Unit 4, McAllen, TX 78503 and is currently estimated at $153,189, approximately $116 per square foot. 3000 S L Ln Unit 4 is a home located in Hidalgo County with nearby schools including Geraldine Palmer Elementary, Kennedy Middle School, and PSJA Southwest Early College High School.
Ownership History
Date
Name
Owned For
Owner Type
Purchase Details
Closed on
Sep 5, 2025
Sold by
Area Holdings Ltd
Bought by
Martinez Rebeca Alanis
Current Estimated Value
Purchase Details
Closed on
May 16, 2024
Sold by
Ramirez Rosa Elia and Ayala Rolando
Bought by
Area Holdings Ltd
Purchase Details
Closed on
Sep 25, 2013
Sold by
Almazan Rosa Maria
Bought by
Ramirez Rosa Elia
Home Financials for this Owner
Home Financials are based on the most recent Mortgage that was taken out on this home.
Original Mortgage
$88,000
Interest Rate
4.46%
Mortgage Type
New Conventional
Purchase Details
Closed on
Aug 19, 2010
Sold by
Argueta Oscar Humberto Siller and Villanueva Elma Guadalupe Gonzalez
Bought by
Almazan Rosa Maria
Home Financials for this Owner
Home Financials are based on the most recent Mortgage that was taken out on this home.
Original Mortgage
$38,000
Interest Rate
4.6%
Mortgage Type
Seller Take Back
Purchase Details
Closed on
Aug 21, 2008
Sold by
Breman Construction Llc
Bought by
Argueta Oscar Humberto Sille
Create a Home Valuation Report for This Property
The Home Valuation Report is an in-depth analysis detailing your home's value as well as a comparison with similar homes in the area
Home Values in the Area
Average Home Value in this Area
Purchase History
| Date | Buyer | Sale Price | Title Company |
|---|---|---|---|
| Martinez Rebeca Alanis | -- | Sierra Title | |
| Area Holdings Ltd | -- | Sierra Title | |
| Ramirez Rosa Elia | -- | Sierra Title Company | |
| Almazan Rosa Maria | -- | Vltc | |
| Argueta Oscar Humberto Sille | -- | Vltc |
Source: Public Records
Mortgage History
| Date | Status | Borrower | Loan Amount |
|---|---|---|---|
| Previous Owner | Ramirez Rosa Elia | $88,000 | |
| Previous Owner | Almazan Rosa Maria | $38,000 |
Source: Public Records
Tax History Compared to Growth
Tax History
| Year | Tax Paid | Tax Assessment Tax Assessment Total Assessment is a certain percentage of the fair market value that is determined by local assessors to be the total taxable value of land and additions on the property. | Land | Improvement |
|---|---|---|---|---|
| 2025 | $2,810 | $149,314 | $30,360 | $118,954 |
| 2024 | $2,810 | $146,793 | $30,360 | $116,433 |
| 2023 | $3,510 | $148,100 | $30,360 | $117,740 |
| 2022 | $3,589 | $139,817 | $30,030 | $109,787 |
| 2021 | $2,941 | $111,621 | $30,030 | $81,591 |
| 2020 | $3,003 | $112,451 | $30,030 | $82,421 |
| 2019 | $3,119 | $112,967 | $25,740 | $87,227 |
| 2018 | $3,159 | $113,841 | $25,740 | $88,101 |
| 2017 | $3,206 | $114,713 | $25,740 | $88,973 |
| 2016 | $3,206 | $114,713 | $25,740 | $88,973 |
| 2015 | $3,209 | $115,587 | $25,740 | $89,847 |
Source: Public Records
Map
Nearby Homes
- 3006 S L Ln
- 3001 S L St
- 3017 S L St Unit C
- 3013 S L St Unit c
- 4312 S M St
- 3008 S M St
- 3008 S M St Unit 4
- 1304 E Pineridge Ave Unit 3
- 3416 S "M" St
- 3016 S L St
- 3016 S L St Unit 1
- 1208 E Pineridge Ave
- 1412 Keeton Ave Unit 25
- 1412 Keeton Ave Unit 19
- 1412 Keeton Ave
- 1200 E Pineridge Ave Unit 4
- 1200 E Pineridge Ave
- 1325 Keeton Ave
- 1412 E Keeton St Unit 3
- 708 E Pineridge Ave
- 3000 S L Ln Unit 3
- 3000 S L Ln Unit 2
- 3002 S L Ln Unit 1
- 3002 S L Ln Unit 4
- 3002 S L Ln Unit lote 2
- 3002 S L #1 L Ln Unit 1
- 3614 S L Ln
- 3001 S L Ln
- 3001 S L Ln
- 3003 S L Ln
- 3003 S L Ln
- 3003 S L Ln Unit C
- 3003 S L Ln Unit D
- 1313 Olympia Ave
- 3001 S L St Unit 4
- 3001 S L St Unit 3
- 3001 S L St Unit 2
- 3001 S L St Unit 2
- 3001 S L St Unit 1
- 3007 S L Ln