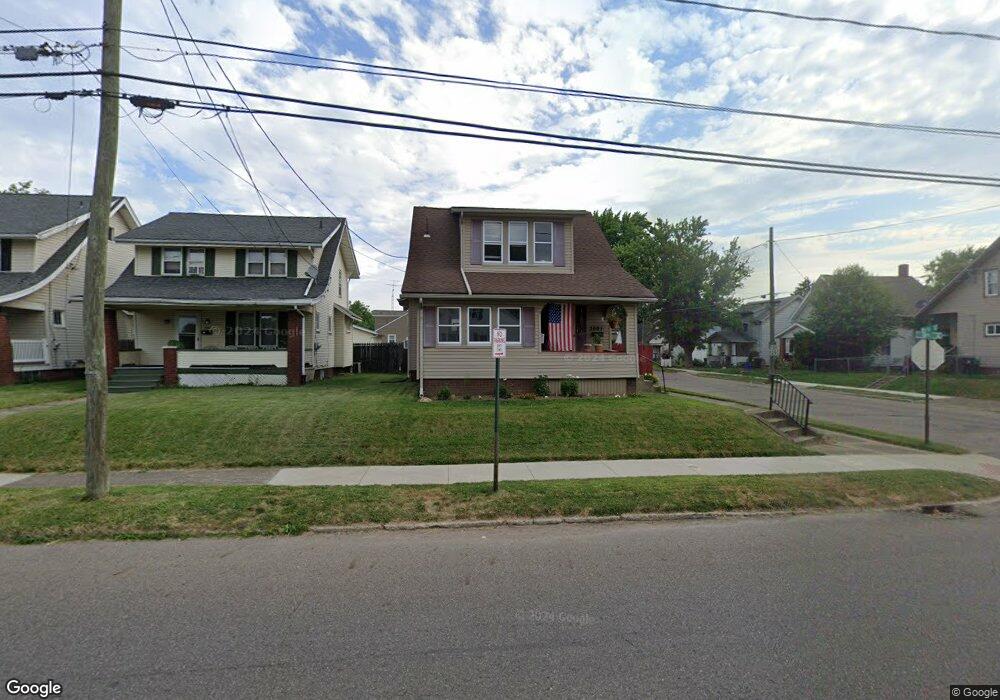
3001 11th St SW Canton, OH 44710
Souers NeighborhoodEstimated Value: $118,000 - $153,000
3
Beds
2
Baths
1,037
Sq Ft
$129/Sq Ft
Est. Value
About This Home
This home is located at 3001 11th St SW, Canton, OH 44710 and is currently estimated at $133,536, approximately $128 per square foot. 3001 11th St SW is a home located in Stark County with nearby schools including Early Learning Center @ Schreiber, Cedar Elementary School, and McGregor Elementary School.
Ownership History
Date
Name
Owned For
Owner Type
Purchase Details
Closed on
Nov 1, 2019
Sold by
Gulley Benjamin Charles and Gulley Ben
Bought by
Lbg Properties Llc
Current Estimated Value
Purchase Details
Closed on
Mar 29, 2018
Sold by
Wells Fargo Bank N A
Bought by
Gulley Benjamin Charles
Purchase Details
Closed on
Feb 15, 2018
Sold by
Grigsby Jetfery W and Grigsby Jeffery W
Bought by
Wells Fargo Bank N A
Purchase Details
Closed on
Feb 25, 2010
Sold by
Comer Robert C and Comer M
Bought by
Grigsby Jeffery W
Home Financials for this Owner
Home Financials are based on the most recent Mortgage that was taken out on this home.
Original Mortgage
$51,548
Interest Rate
5.11%
Mortgage Type
FHA
Purchase Details
Closed on
May 8, 2003
Sold by
Shanks Jimmie D and Shanks Virginia R
Bought by
Comer Robert C and Comer M
Purchase Details
Closed on
Aug 29, 1997
Sold by
Fazio William C
Bought by
Shanks Jimmie D and Feemster Virginia
Home Financials for this Owner
Home Financials are based on the most recent Mortgage that was taken out on this home.
Original Mortgage
$33,400
Interest Rate
7.57%
Mortgage Type
New Conventional
Purchase Details
Closed on
Mar 26, 1993
Create a Home Valuation Report for This Property
The Home Valuation Report is an in-depth analysis detailing your home's value as well as a comparison with similar homes in the area
Home Values in the Area
Average Home Value in this Area
Purchase History
| Date | Buyer | Sale Price | Title Company |
|---|---|---|---|
| Lbg Properties Llc | -- | None Available | |
| Gulley Benjamin Charles | $12,100 | None Available | |
| Wells Fargo Bank N A | $36,000 | None Available | |
| Grigsby Jeffery W | $52,500 | Attorney | |
| Comer Robert C | $46,000 | -- | |
| Shanks Jimmie D | $36,000 | -- | |
| -- | $25,000 | -- |
Source: Public Records
Mortgage History
| Date | Status | Borrower | Loan Amount |
|---|---|---|---|
| Previous Owner | Grigsby Jeffery W | $51,548 | |
| Previous Owner | Shanks Jimmie D | $33,400 |
Source: Public Records
Tax History Compared to Growth
Tax History
| Year | Tax Paid | Tax Assessment Tax Assessment Total Assessment is a certain percentage of the fair market value that is determined by local assessors to be the total taxable value of land and additions on the property. | Land | Improvement |
|---|---|---|---|---|
| 2025 | -- | $41,130 | $3,850 | $37,280 |
| 2024 | $626 | $41,130 | $3,850 | $37,280 |
| 2023 | $1,195 | $18,660 | $3,500 | $15,160 |
| 2022 | $1,109 | $18,660 | $3,500 | $15,160 |
| 2021 | $1,121 | $18,660 | $3,500 | $15,160 |
| 2020 | $989 | $14,740 | $2,910 | $11,830 |
| 2019 | $861 | $14,740 | $2,910 | $11,830 |
| 2018 | $850 | $14,740 | $2,910 | $11,830 |
| 2017 | $905 | $14,290 | $2,840 | $11,450 |
| 2016 | $908 | $14,290 | $2,840 | $11,450 |
| 2015 | $914 | $14,290 | $2,840 | $11,450 |
| 2014 | $1,019 | $14,990 | $2,980 | $12,010 |
| 2013 | $491 | $14,990 | $2,980 | $12,010 |
Source: Public Records
Map
Nearby Homes
- 1023 Wertz Ave SW
- 929 Wertz Ave SW
- 2711 Blair Place SW
- 1019 Dartmouth Ave SW
- 1013 Maryland Ave SW
- 846 Maryland Ave SW
- 921 Clarendon Ave SW
- 3029 7th St SW
- 2416 9th St SW
- 1009 Arlington Ave SW
- 931 Smith Ave SW
- 1238 Arlington Ave SW
- 1361 Crescent Rd SW
- 2310 7th St SW
- 3204 14th St SW
- 241 Raymont Ct SW
- 3800 11th St SW
- 123 Linwood Ave NW
- 1227 Greenfield Ave SW
- 1201 Benskin Ave SW
- 3007 11th St SW
- 1025 Wertz Ave SW
- 3011 11th St SW
- 2835 11th St SW
- 3015 11th St SW Unit A
- 3015 11th St SW
- 3015 11th St SW Unit rear
- 1028 Wertz Ave SW
- 2831 11th St SW
- 1103 Wertz Ave SW
- 1024 Wertz Ave SW
- 3006 11th St SW
- 3019 11th St SW
- 2836 11th St SW
- 1019 Wertz Ave SW
- 2827 11th St SW
- 2832 11th St SW
- 3023 11th St SW
- 2826 Blair Place SW
- 2837 Blair Place SW