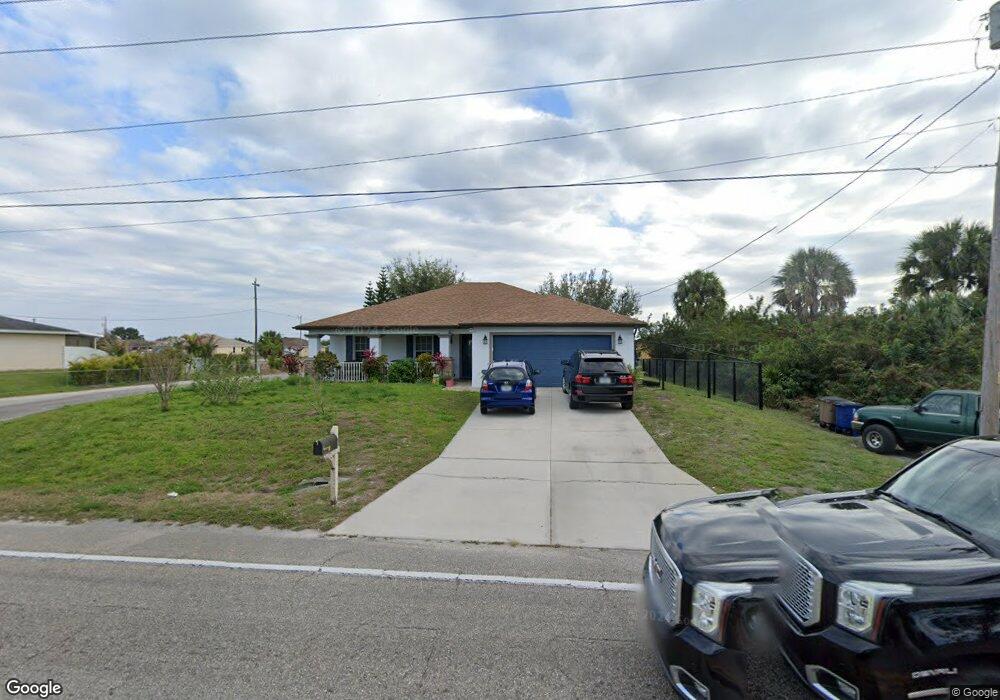
3001 23rd St SW Unit 3 Lehigh Acres, FL 33976
Alabama NeighborhoodEstimated Value: $227,000 - $312,000
3
Beds
2
Baths
1,460
Sq Ft
$190/Sq Ft
Est. Value
About This Home
This home is located at 3001 23rd St SW Unit 3, Lehigh Acres, FL 33976 and is currently estimated at $277,548, approximately $190 per square foot. 3001 23rd St SW Unit 3 is a home located in Lee County with nearby schools including Lehigh Elementary School, Gateway Elementary School, and Tice Elementary School.
Ownership History
Date
Name
Owned For
Owner Type
Purchase Details
Closed on
May 10, 2012
Sold by
Torres Idalberto M and Tielves Amarilys
Bought by
Ramos Olga
Current Estimated Value
Purchase Details
Closed on
Feb 25, 2011
Sold by
Facundes Kennedy
Bought by
Vilinskaia Lioudmila
Purchase Details
Closed on
Mar 1, 2005
Sold by
Dalessandro Frank
Bought by
Torres Idalberto M
Home Financials for this Owner
Home Financials are based on the most recent Mortgage that was taken out on this home.
Original Mortgage
$188,250
Interest Rate
5.6%
Mortgage Type
Unknown
Purchase Details
Closed on
Jan 18, 2005
Sold by
First Home Builders Of Florida
Bought by
Dalessandro Frank and Dalessandro Builder Spec Trust
Home Financials for this Owner
Home Financials are based on the most recent Mortgage that was taken out on this home.
Original Mortgage
$188,250
Interest Rate
5.6%
Mortgage Type
Unknown
Purchase Details
Closed on
Oct 15, 2003
Sold by
Roe Donald W
Bought by
Fl 200 L L C
Create a Home Valuation Report for This Property
The Home Valuation Report is an in-depth analysis detailing your home's value as well as a comparison with similar homes in the area
Home Values in the Area
Average Home Value in this Area
Purchase History
| Date | Buyer | Sale Price | Title Company |
|---|---|---|---|
| Ramos Olga | $65,000 | Paradise Professional Title | |
| Vilinskaia Lioudmila | $2,400 | Attorney | |
| Torres Idalberto M | $188,300 | First Home Title Inc | |
| Dalessandro Frank | $5,209,600 | First Home Title Inc | |
| Fl 200 L L C | $3,800 | -- |
Source: Public Records
Mortgage History
| Date | Status | Borrower | Loan Amount |
|---|---|---|---|
| Previous Owner | Torres Idalberto M | $188,250 | |
| Previous Owner | Dalessandro Frank | $5,344,000 |
Source: Public Records
Tax History Compared to Growth
Tax History
| Year | Tax Paid | Tax Assessment Tax Assessment Total Assessment is a certain percentage of the fair market value that is determined by local assessors to be the total taxable value of land and additions on the property. | Land | Improvement |
|---|---|---|---|---|
| 2025 | $3,417 | $216,967 | $21,803 | $191,518 |
| 2024 | $3,417 | $247,584 | $17,025 | $225,722 |
| 2023 | $3,417 | $263,206 | $15,192 | $244,668 |
| 2022 | $2,965 | $176,289 | $0 | $0 |
| 2021 | $2,588 | $160,263 | $8,906 | $151,357 |
| 2020 | $2,508 | $150,196 | $5,000 | $145,196 |
| 2019 | $2,466 | $142,932 | $4,700 | $138,232 |
| 2018 | $1,338 | $93,429 | $0 | $0 |
| 2017 | $1,296 | $91,507 | $0 | $0 |
| 2016 | $1,261 | $100,295 | $3,800 | $96,495 |
| 2015 | $1,254 | $89,002 | $3,360 | $85,642 |
| 2014 | -- | $75,196 | $2,715 | $72,481 |
| 2013 | -- | $62,705 | $2,600 | $60,105 |
Source: Public Records
Map
Nearby Homes
- 2913 23rd St SW
- 3003 Irene Ave S
- 4606 Irene Ave S
- 2911 23rd St SW
- 4704 Karen Ave S
- 4202 Loraine Ave S
- 1610 Loraine Ave S
- 2919 25th St W
- 2911 22nd St SW
- 2915 21st St SW
- 2912 26th St SW
- 2929 20th St SW
- 54 Sunshine Blvd S
- 3003 20th St SW
- 3013 26th St SW
- 2809 25th St SW
- 2928 20th St SW
- 2922 20th St SW
- 2814 25th St SW
- 2812 23rd St SW
- 3001 SW 23 St #3
- 2921 23rd St SW Unit 3
- 3002 23rd St SW
- 3000 23rd St SW
- 3005 23rd St SW
- 2920-2922 23rd St SW
- 2920 23rd St SW
- 3002 24th St SW
- 2919 23rd St SW
- 3008 23rd St SW
- 3006 23rd St SW
- 3007 23 St SW
- 2918 24th St SW
- 2919 22nd St SW
- 2916 24th St SW
- 2917 23rd St SW
- 3006 SW 24th St
- 3006 24 Th St SW
- 3009 23 St SW
- 3001 24th St SW Unit 3