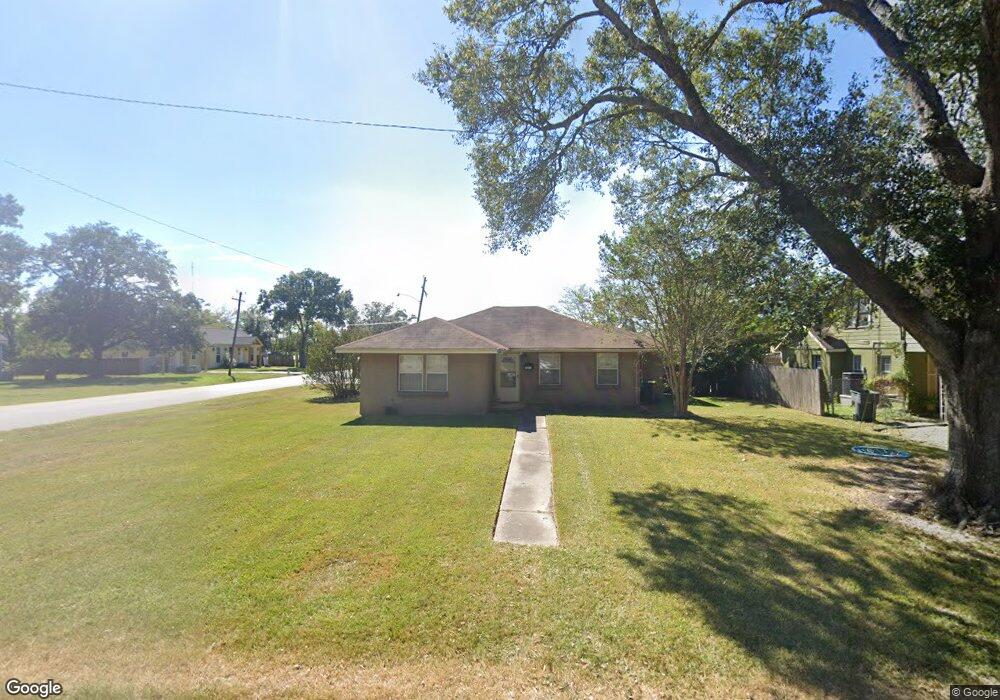
3001 Alamo Ave Port Arthur, TX 77642
Estimated Value: $114,000 - $142,000
3
Beds
2
Baths
1,474
Sq Ft
$91/Sq Ft
Est. Value
About This Home
This home is located at 3001 Alamo Ave, Port Arthur, TX 77642 and is currently estimated at $134,032, approximately $90 per square foot. 3001 Alamo Ave is a home located in Jefferson County with nearby schools including Houston Elementary School, Abraham Lincoln Middle School, and Memorial High School.
Ownership History
Date
Name
Owned For
Owner Type
Purchase Details
Closed on
Jan 13, 2025
Sold by
Phan Le Thanh
Bought by
Le Bobby P and Huynh Yen K
Current Estimated Value
Purchase Details
Closed on
Oct 24, 2024
Sold by
Le Bobby P and Huynh Yen K
Bought by
Phan Le Thanh
Purchase Details
Closed on
Jun 11, 2008
Sold by
Garcia Horacio and Damian Margarita
Bought by
Le Bobby P and Huynh Yen K
Purchase Details
Closed on
Jul 18, 2007
Sold by
Bernal Lydia Beatrice
Bought by
Garcia Horacio and Damian Margarita
Create a Home Valuation Report for This Property
The Home Valuation Report is an in-depth analysis detailing your home's value as well as a comparison with similar homes in the area
Home Values in the Area
Average Home Value in this Area
Purchase History
| Date | Buyer | Sale Price | Title Company |
|---|---|---|---|
| Le Bobby P | -- | None Listed On Document | |
| Phan Le Thanh | -- | None Listed On Document | |
| Le Bobby P | -- | None Available | |
| Garcia Horacio | -- | None Available |
Source: Public Records
Tax History Compared to Growth
Tax History
| Year | Tax Paid | Tax Assessment Tax Assessment Total Assessment is a certain percentage of the fair market value that is determined by local assessors to be the total taxable value of land and additions on the property. | Land | Improvement |
|---|---|---|---|---|
| 2025 | $4,320 | $151,405 | $9,240 | $142,165 |
| 2024 | $4,320 | $150,811 | $4,204 | $146,607 |
| 2023 | $4,320 | $137,484 | $4,204 | $133,280 |
| 2022 | $4,225 | $133,041 | $4,204 | $128,837 |
| 2021 | $4,115 | $124,156 | $4,204 | $119,952 |
| 2020 | $1,465 | $65,143 | $4,204 | $60,939 |
| 2019 | $2,025 | $63,530 | $4,200 | $59,330 |
| 2018 | $1,437 | $63,530 | $4,200 | $59,330 |
| 2017 | $1,393 | $63,530 | $4,200 | $59,330 |
| 2016 | $1,861 | $63,530 | $4,200 | $59,330 |
| 2015 | $1,486 | $63,530 | $4,200 | $59,330 |
| 2014 | $1,486 | $63,530 | $4,200 | $59,330 |
Source: Public Records
Map
Nearby Homes