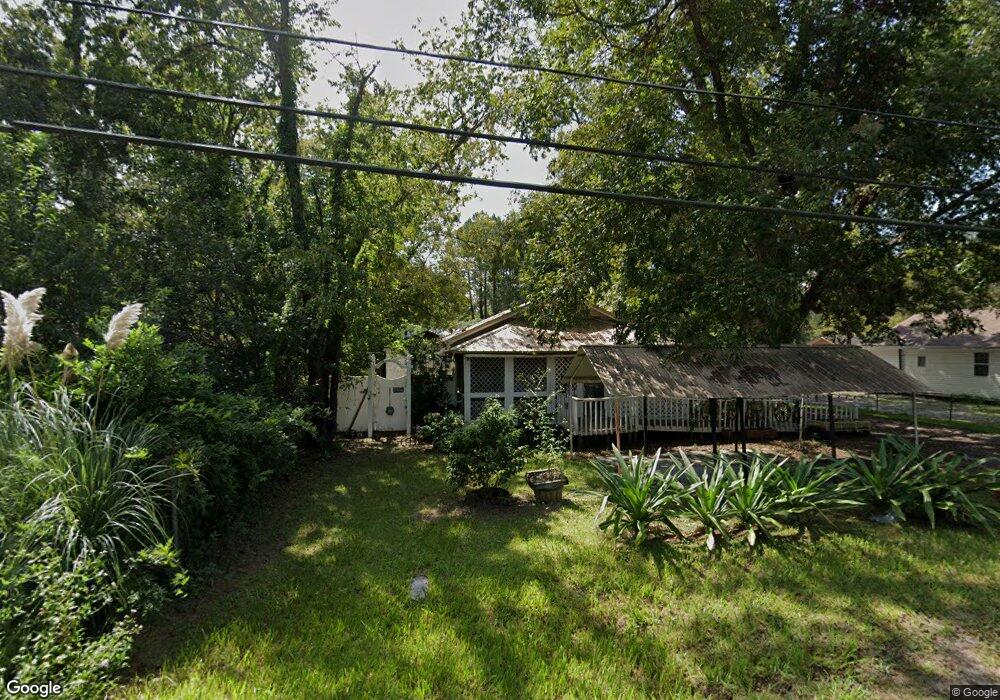
3001 Albany Ave Waycross, GA 31503
Estimated Value: $45,000 - $122,000
--
Bed
1
Bath
900
Sq Ft
$91/Sq Ft
Est. Value
About This Home
This home is located at 3001 Albany Ave, Waycross, GA 31503 and is currently estimated at $81,979, approximately $91 per square foot. 3001 Albany Ave is a home located in Ware County with nearby schools including Waresboro Elementary School, Ware County Middle School, and Ware County High School.
Ownership History
Date
Name
Owned For
Owner Type
Purchase Details
Closed on
Nov 22, 2013
Sold by
Morrison John L
Bought by
Moorison James M
Current Estimated Value
Home Financials for this Owner
Home Financials are based on the most recent Mortgage that was taken out on this home.
Original Mortgage
$29,600
Outstanding Balance
$7,867
Interest Rate
4.16%
Mortgage Type
New Conventional
Estimated Equity
$74,112
Purchase Details
Closed on
Feb 22, 2008
Sold by
Spivey Kimberly
Bought by
Dickson David S
Home Financials for this Owner
Home Financials are based on the most recent Mortgage that was taken out on this home.
Original Mortgage
$40,300
Interest Rate
5.46%
Mortgage Type
New Conventional
Purchase Details
Closed on
Oct 15, 2004
Sold by
Dickson David W
Bought by
Dickson David W and Dickson Kimberly S
Purchase Details
Closed on
Nov 14, 2002
Sold by
Weathersbee Paul E
Bought by
Dickson David W
Create a Home Valuation Report for This Property
The Home Valuation Report is an in-depth analysis detailing your home's value as well as a comparison with similar homes in the area
Home Values in the Area
Average Home Value in this Area
Purchase History
| Date | Buyer | Sale Price | Title Company |
|---|---|---|---|
| Moorison James M | $37,000 | -- | |
| Dickson David S | -- | -- | |
| Morrison John L | $45,000 | -- | |
| Dickson David W | -- | -- | |
| Dickson David W | $26,500 | -- |
Source: Public Records
Mortgage History
| Date | Status | Borrower | Loan Amount |
|---|---|---|---|
| Open | Moorison James M | $29,600 | |
| Previous Owner | Morrison John L | $40,300 |
Source: Public Records
Tax History Compared to Growth
Tax History
| Year | Tax Paid | Tax Assessment Tax Assessment Total Assessment is a certain percentage of the fair market value that is determined by local assessors to be the total taxable value of land and additions on the property. | Land | Improvement |
|---|---|---|---|---|
| 2024 | $442 | $18,100 | $3,960 | $14,140 |
| 2023 | $466 | $18,404 | $1,774 | $16,630 |
| 2022 | $531 | $18,404 | $1,774 | $16,630 |
| 2021 | $460 | $14,652 | $1,774 | $12,878 |
| 2020 | $408 | $12,860 | $1,774 | $11,086 |
| 2019 | $404 | $12,501 | $1,774 | $10,727 |
| 2018 | $422 | $12,928 | $1,774 | $11,154 |
| 2017 | $421 | $12,928 | $1,774 | $11,154 |
| 2016 | $421 | $12,928 | $1,774 | $11,154 |
| 2015 | $425 | $12,928 | $1,774 | $11,154 |
| 2014 | $425 | $12,928 | $1,774 | $11,154 |
| 2013 | -- | $12,928 | $1,774 | $11,154 |
Source: Public Records
Map
Nearby Homes
- 2885 Longwood Rd
- 850 Woodard Ln
- 2867 Evergreen Rd
- 2836 Evergreen Rd
- 2857 Cherokee St
- 1238 Red Keen Rd
- 2180 Fulford Rd Unit n/a
- 1261 Lake St
- 0 Anita South St
- 1210 N Augusta Ave
- 2117 Tamara Rd
- Lot 155 N Augusta Avenue Cherokee Ave
- 274 S Anita St
- 2066 Cherokee St
- 1300 Stanton Ave
- 1803 Lamar Ave
- 400 Smith Rd
- 524 Smith Rd
- 0 Anita St
- 2869 Ben St
- 3005 Albany Ave
- 2997 Albany Ave
- 3011 Albany Ave
- 2993 Albany Ave
- 3000 Albany Ave
- 2994 Albany Ave
- 2982 Albany Ave
- 3013 Albany Ave
- 2970 Albany Ave
- 2977 Albany Ave
- 3017 Albany Ave
- 3006 Albany Ave
- 3021 Albany Ave
- 2960 Albany Ave
- 2961 Albany Ave
- 3012 Albany Ave
- 3023 Albany Ave
- 2950 Albany Ave
- 3027 Albany Ave
- 2938 Albany Ave